4. Integrated scoreboards
One reason for implementing BI is to create a self-service model for employees to get the information they need. In the past, managers often had to ask the IT department for help to look at information in new and more creative ways.
In December 2009, Mesilla Valley Transportation implemented a BI platform from Microsoft to gather data from various sources and create customized reports and dashboards for analysis.
 Lexington, S.C.-based Southeastern Freight Lines uses a Microsoft BI platform to give each of its 80 service centers a real-time dashboard. Each service center has 18 key measurements.
Today, operators for the Las Cruces, N.M.-based truckload fleet receive daily e-mails with dashboard reports that are presented in familiar office tools such as Excel spreadsheets and PDF files with hyperlinks to the company’s live Web portal via Microsoft SharePoint.
The reports show a variety of KPIs, both on a macro and individual level. The individual dashboards show fleet managers the tasks that need to be cleared from their queue, such as out-of-route drivers, unassigned drivers and projected late loads.
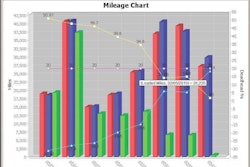
MVT also uses the Microsoft BI platform to create dashboards for its incentive plans for drivers, managers and departments. The dashboards show various benchmarks for mpg, fleet miles, revenue and driver turnover, among other metrics.
SEFL uses a Microsoft BI platform to give each of its 80 service centers a real-time dashboard; each service center has 18 key measurements. The Lexington, S.C.-based less-than-truckload company has incorporated statistical process control tools into the service center dashboards; each measure has upper and lower control limits.
When a measure falls outside those limits, it becomes an active process for management. “Any one time, at least one of those key measures has to be under review to make it better,” says Vick.
SEFL has 2,800 trucks and 80 terminals in the Sunbelt area from El Paso, Texas, to Virginia, and down to the Florida Keys. The company handles 60,000 shipments a day. “That is a lot of data coming at you,” Vick says. “You have got to be able to analyze and display it in a manner so that people can do something with it.”
SEFL’s SharePoint portal provides quick access to operational performance. Users also can view real-time shipment information in the company’s dispatch software and make changes, such as reassigning shipments to avoid downstream errors.
With its data-driven approach, SEFL has reduced pickup-and-delivery costs by 10.7 percent over the past five years, Vick says. “We don’t like stuff sitting in one place,” he says. “We are grabbing data in different systems and displaying it quickly.”
Once users see the difference – and the results – of having faster, more convenient access to information, BI becomes a “hungry beast,” says Mike Kelley, MVT’s director of information systems.
“Once people start consuming information, their appetite grows more,” Kelley says. “Other departments say ‘we would like some of this also.’ It blossoms quickly.”
5. Strategic focus
As BI matures, it becomes more challenging to distill the abundance of operational metrics into more strategic measures. Driver turnover is an operational measure; a strategic measure might determine how many drivers at a company fit within its top “A” profile for drivers.
McLeod Software’s soon-to-be-released McLeod Navigator product is designed to help carriers create what it calls a balanced scorecard framework. As part of this product, the company plans to offer a workshop to help users create 15 to 20 strategic measures that are critical to their companies.
The framework consists of four perspectives: 1) financial, 2) customer, 3) internal process and 4) people and tools. Each perspective contains four or five strategic measures.
The strategic measures from each perspective can be put in a dashboard within Navigator to manage. The system is designed to pull data from McLeod’s LoadMaster and PowerBroker databases, as well as external sources.
As the volume and complexity of information continues to grow, so do the possibilities to gain deeper insights and get further ahead of your information – and the competition.


