“It didn’t store some of the data we wanted,” said Kelley, director of information technology for the Las Cruces, N.M.-based carrier, Dec. 3, at the CCJ Fall Symposium in Scottsdale, Ariz. Kelly spoke during a breakout session on technology titled “modernizing your fleet with business intelligence.”
The TMS system showed the last person who touched the data, for instance, but did not show if they had changed a value. Without this audit capability, a customer service representative could have easily changed the delivery date of a load that was late to escape detection.
Besides needing better ways to store and audit data, Mesilla Valley Transport (MVT) also needed to gather and correlate information from multiple systems into a single database used for analysis.
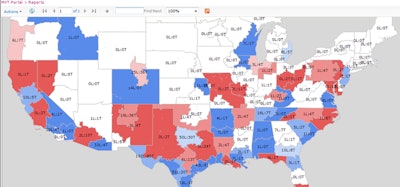
Nine years later, MVT has a single “data warehouse” and endless possibilities for reporting. It has created real-time, dashboard-style reports that are accessible through a Microsoft SharePoint webpage and through daily, scheduled emails.
As it began to develop this BI platform with Microsoft products, Kelley learned some early lessons the hard way. One was to not query data directly from its primary TMS database.
“It brought our production box to its knees,” he said. MVT soon began to run queries against a secondary, replicated AS400 database. “If you bring the (secondary) box to its knees it doesn’t slow down the flow of trucks.”
Another lesson learned is what to measure. During the early stages of BI, Kelley recalls having a customer service manager that was very adamant about on-time deliveries. This focus was causing customer service reps to turn down freight to avoid the possibility of late deliveries.
On-time service is a good metric, but “you don’t want it to drive your business and choose what loads to take,” he said. “You have to make sure you understand the ramifications of what you are measuring.”
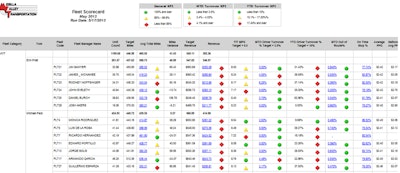
MVT has advanced its business intelligence in stages. At first, Kelley says the IT department created numerous reports. Next, it developed key performance indicators for specific people according to their responsibilities within the company. The KPIs include metrics for utilization, mpg, driver turnover, out-of-route, on-time service and many more areas.

The dashboards have pop-up boxes that show more details behind the KPI when a mouse pointer hovers over a metric.
The team also created scorecards for employees, drivers and customers to rank and benchmark performance over time. Currently, the team is focused on integrating the visual presentation of information with workflow.
“That is constantly what we are doing now,” he said. “We have started leveraging workflow to put metrics in front of people and give them a path to follow for that data,” he said.
Examples of workflows MVT has created with its BI tools include:
Fault codes. Engine fault code information is captured through its onboard computing and mobile communications platform. Using its Microsoft SharePoint system, fault codes are reparsed into a “human readable” form the shop uses to instantly know what is happening and how to respond.
Inspections. MVT captures tire pressure, tread depth and truck number of vehicles as they drive over sensor plates installed at the front gate of its facilities. MVT created a workflow that checks the driver’s safety qualifications, such as missing logs, before they reach the next check point. It has also developed mobile inspection software to capture any damage that happened to vehicles and identify who was responsible.
Accessorials. A dashboard shows customer service managers orders where accessorial charges can be collected. Its BI platform continuously queries order information behind the scenes to identify opportunities to collect detention, for example, by monitoring the status of its equipment and loads.
The company has a potential to capture $300,000 a month. Currently it is collecting $50,000, he said. Sometimes the benefits are not all monetary. Service managers can also use the data to play “let’s make a deal” with customers, such as trade a late load for a detention event.
Driver portal. Rather than mail its driver settlements and payroll stubs, drivers can now login to a portal. They can also view the same performance metrics that fleet managers see.
The possibilities for using business intelligence (BI) are endless at MVT, Kelley said. He did caution the fleet executives who might be considering adopting a similar strategy, however.
“As you get involved, the hunger for data that starts to surface is going to be huge.”


