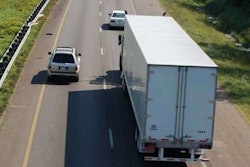
Carriers spent nearly 68 cents a mile on driver wages and benefits in 2016, according to ATRI’s data.
Driver wages for the second straight year topped carriers’ cost-per-mile spending in 2016, according to data released Oct. 18 by the American Transportation Research Institute. Carrier costs on the whole climbed 1.5 cents a mile last year, per the report, with increases in spending on driver wages and benefits outpacing savings from lower fuel expenditures.
Carriers’ total cost-per-mile in 2016 was $1.592. ATRI did not say how many carriers submitted responses to the survey, but in sum they operate 89,664 power units. ATRI has produced its “An Analysis of the Operational Costs of Trucking” since 2008. Until the 2015 calendar year, fuel costs had topped per-mile spending. However, upward pressure on driver wages in recent years — combined with cheaper fuel costs and more fuel efficient equipment — spurred driver wages to overtake fuel the last two years. ATRI predicts costs to rise again in 2017, “with the same driver shortage factors holding firmly in place and a number of indications that average diesel prices will slowly rise,” the research firm says.
Where costs rose
Spending on driver wages averaged 52.3 cents a mile for the carriers surveyed — a 2.4-cent per-mile increase from 2015. Carriers spent on average 15.5 cents a mile on driver benefits in 2016, also a 2.4-cent increase from the year prior.
Expenditures on truck and trailer leasing and purchases also climbed in 2016, rising 2.5 cents a mile to 25.5 cents.
 This pie chart in ATRI’s report shows the breakdown of survey respondents by fleet size.
Repair and maintenance costs rose a penny per mile to 16.6 cents. Per-mile costs for tolls, permits and insurance premiums all rose a fraction of a penny from 2015.
Where costs dipped
Spending on fuel fell a few cents a mile, down to 33.6 from 2015’s 40.3 and well below 2014’s 58.4 cents and 2013’s 64.5 cents. ATRI attributes the declines in fuel spending to both cheaper diesel prices and increased miles per gallon.
Spending on tires also dipped slightly, eight-tenths of a cent to 3.5 cents a mile.
ELD adoption
Adoption of electronic logging devices in 2016 rose sharply, with 74.8 percent of survey respondents saying they use the devices. That’s an increase of 11 percentage points from the year prior. However, that number includes few owner-operators and many large fleets.


Survey respondent details
Of the fleets surveyed, 16 percent operate more than 1,000 power units, and 21 percent operate between 251 and 1,000 power units. Sixteen percent run fewer than 5 power units, and 9 percent run between 5 and 25 power units. More than a quarter, 26 percent, run between 26 and 100 power units, and the remaining 12 percent operate between 101 and 250 power units.
Respondents operate a total of 85,305 tractor-trailers and 4,359 straight trucks. The average size of respondents’ fleet was 838 power units. Fifty-two percent operate in the truckload industry, and 24 percent work in LTL. Specialized operators accounted for 24 percent of survey respondents.
The median annual revenue of respondents was $17.797 million, but the average revenue of respondents was $307.4 million, showing the weight of the annual revenue of the largest fleets who submitted cost information for the survey.