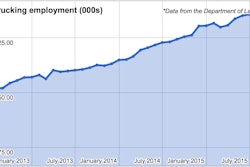
CCJ Indicators rounds up the latest reports on trucking business indicators on rates, freight, equipment, the economy and more.
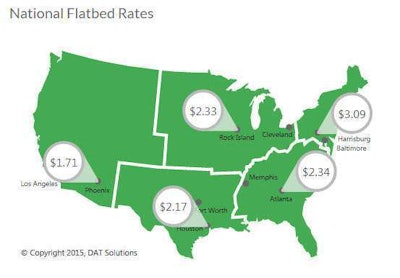
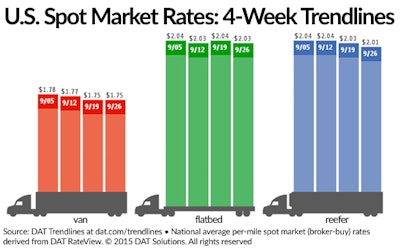
Go east, young man (for flatbed rates): As you can see in the map above from DAT Solutions, flatbed rates last week (Sept. 20-26) were strongest on the East Coast, particularly so in the Northeast. They wane heading westward, falling nearly a buck and a half by the time you hit Phoenix. Flatbed rates nationwide fell a penny on the spot market despite a surge in demand, as flatbed capacity offset the increased freight demand, DAT reports:
Reefer rates on the spot market fell by two cents in the week due to a drop in load volume and a small swing in load-to-truck ratio, while van rates were flat:
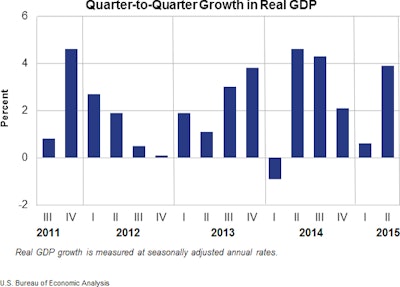
Economy outpaces expectations in 2Q: The U.S. economy grew at an annualized rate of 3.9 percent in the second quarter, according to the Department of Commerce’s quarterly GDP report. That growth was stronger than what analysts had forecasted.
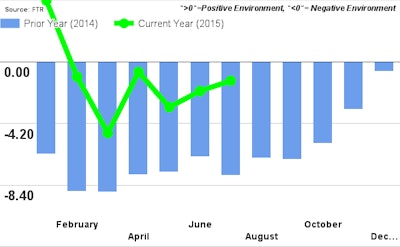
Tight capacity sinks conditions for shippers: FTR’s monthly Shippers Conditions Index showed a reading in July that reflected overall a negative environment for shippers, based on OK freight demand, tight capacity and rising freight rates, says FTR’s Jonathan Starks. Stronger freight, higher fuel prices and regulatory impacts on carriers will likely cause conditions for shippers to see negative downturn the rest of this year and in 2016, FTR says.

