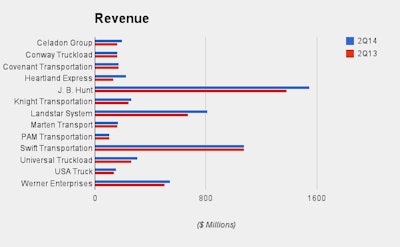
The earnings report season provided a generally positive outlook on the financial health of large truckload carriers, with a few small surprises. The carriers were equally sure of one thing: The industry must find more drivers to grow. Below are charts putting the second-quarter corporate results head-to-head, along with a roundup of some executive commentary. (NOTE: Companies vary in the measures they report and the way they calculate them; complete information may be found in the Investor Relations section of the publicly traded carriers’ websites.)
A large post-report drop in the price of Swift Transportation (No. 3 on the CCJ Top 250) shares gave Wall Street plenty to talk about but, as company officials explained, the problem wasn’t its second-quarter performance: Rather, the slide came on Swift’s lower than expected expectations for the third quarter.
And much of the near term earnings pressure comes from an aggressive program to improve driving training and retention, and that means higher driver pay for the truckload giant.
Those cost increases will take effect ahead of the rate increases and operational improvements expected to cover them, the company says – and that’s not the way investors like to do business, apparently.
But Swift stands by its plan.
“We have decided that the best investment at this time for the future of Swift is to invest in our drivers,” said President and COO Richard Stocking in the earnings follow-up with analysts. “The driver market is tight and not trending favorably. Driving is a tough job where you spend a lot of time away from home and family and it deters a lot of people.
“However, we are hyper-focused on making sure we can deliver the best life possible to our drivers. We believe we are better positioned than most companies to provide our drivers with a wide variety of opportunities, competitive pay packages, industry-leading miles and predictability in their lives.”
Swift declined, for competitive reasons, to detail the driver pay plan, “other than to say it is the largest increase we have ever given,” added Chairman and CEO Jerry Moyes.
Another earnings report that garnered the attention of the investment community was that of USA Truck (No. 50 on the CCJ Top 250). The company turned a profit.


“We posted our first quarter of positive net income in three years,” said President and CEO John Simone. “While continuing the work of implementing our turnaround plan, the progress we are making is evident in virtually every area of our business. Despite the harsh winter that impacted the trucking industry as the year began, our results, on an adjusted basis, for the first six months of 2014 are also positive.
“Although the shortage of drivers and more restrictive hours-of-service rules continue to present challenges for our industry, the demand and pricing environment in the truckload marketplace is healthy and we believe our 2014 goals of positive consolidated operating income and adjusted EPS are achievable.”
Fleet truck counts have trended slightly downward over the past twelve months – but it’s difficult to grow a fleet when there aren’t enough drivers for the trucks you already have. Most companies in this group are working smarter rather than trying to throw more equipment at the problem.
At Covenant Transportation Group Inc. (No. 40 on the CCJ Top 250), Chairman, President and CEO David R. Parker explained that his truck count had “stabilized” in the second quarter.
“The quarter was characterized by robust freight volumes, customers seeking a high level of service, an ability to improve yields through lane engineering and higher rates, and strong competition for an increasingly short supply of qualified professional drivers,” Parker said.
Covenant’s average freight revenue per tractor, freight revenue per total mile and average length of haul and average miles per unit all improved in the second quarter.
“The main factors impacting the improved utilization were a 220 basis point increase in the percentage of our fleet comprised of team-driven tractors and a tighter overall freight network, partially offset by the more stringent hours of service regulations imposed in July 2013 and a slightly lower seated truck percentage,” Parker said. “On average, approximately 4.7 percent of our fleet lacked drivers during the 2014 quarter compared with approximately 4.3 percent during the 2013 quarter.”
In this table, Con-way Truckload’s truck count does not include it’s growing owner-operator fleet. Con-way Truckload is part of Con-way Inc. (No. 5 on the CCJ Top 250), but the company breaks out several key TL metrics in its quarterly reports. These are included here for comparison.
Despite issues with rail congestion, intermodal leader J.B. Hunt Transport Services (No. 6 on the CCJ Top 250) continues to lead the public TL group in revenue, income and other metrics.
“The slowdown in train velocity and the difficult driver recruiting environment has challenged our growth in JBI [the intermodal segment]. We are pleased we were able to maintain profitability levels despite these obstacles. The worsening driver supply conditions will continue to be a headwind for DCS [dedicated] and JBT [truckload] as well. The planned improvement in JBT is ahead of schedule and though there is more to do, we are extremely pleased with the progress thus far,” said John N. Roberts III, president and CEO.
J.B. Hunt’s revenue per tractor per week data point is from its Truck division, which is now the smallest of the company’s four segments with just over 100,000 loads for the quarter hauled by 1,860 trucks.
The Intermodal segment, by contrast, moved more than 429,000 loads. The Dedicated segment moved more than 500,000 loads with 6,559 trucks and with average weekly truck revenue of $4,117 – about the same as the Truck segment, but with an average length of haul of just 178 miles, compared to 384 for Truck.
With the year-end acquisition of Gordon Trucking Inc. (No. 58 on the CCJ Top 250 in 2013), the historically industry-leading OR at Heartland Express (No. 28 on the CCJ Top 250) has taken a hit: After soaring to 90.8 percent in the first quarter, the company has already reduced it to 82.1 percent, making it 86.4 percent for the first half of 2014 – and that’s without the combination of the two respective company’s information technology platforms, Heartland notes. That integration is expected in the third quarter.
For those reporting unloaded miles, the group showed mixed results. Among those that managed to improve in the metric was Knight Transportation (No. 26 on the CCJ Top 250), and its truckload division performed well across the board: Revenue per tractor increased 6 percent year over year, with a 5.6 percent improvement in revenue per loaded mile, a 3.1 percent increase in average length of haul to 497 miles and the 140 basis point improvement in non-paid empty mile percentage, Chairman and CEO Kevin Knight explained.
“Although the relationship between customer demand and industry-wide supply of available trucks was favorable to the truckload carriers, the industry continues to be faced with multiple challenges that have led to higher costs, including rising driver pay, increased regulation, additional maintenance cost associated with the 2010 EPA emission engines, and rising equipment cost,” Knight said. “We continue to intensify our cost control efforts in order to manage these inflationary pressures.”