On one occasion, a data analyst was looking at the crash and risk indicators of a grocery distribution fleet. The indicators, reported by the fleet’s telematics system, showed a high degree of risk.
The analyst asked Osterberg if perhaps the reefer units on the front of trailers were the problem.
“That’s what the data was leading him to say,” says Osterberg, who explained that environmental factors like drivers operating at night and in metropolitan areas were more likely the culprit.
The point is that without definitive driver performance data, questions remain and incorrect conclusions can be drawn. Having massive amounts of data is not always useful either.
A fast-growing number of fleets are now using technology that combines video with telematics data to accurately assess driver performance.
“That’s the beauty of video,” Osterberg says. “The clearer the picture you get is what gives you the understanding to tailor interventions more effectively.”
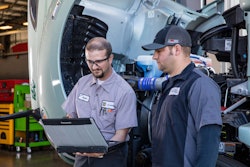
Osterberg shared a number of anecdotes with CCJ during a meeting at SmartDrive’s office in San Diego on Thursday, Jan. 7. Osterberg retired from Schneider National (CCJ Top 250, No. 8) in June, 2015, as the company’s senior vice president of safety, security and driver training. He recently joined SmartDrive’s board of advisors.
The purpose of the meeting was to give CCJ a look at the evolution of SmartDrive’s video analytics platform into the SmartIQ Transportation Intelligence Suite. SmartDrive executives say the new product is meant for fleets of all sizes and analytical skillsets.
By and large, fleets are aware of the safety and legal benefits of using video event recorders, said Steve Mitgang, chief executive of SmartDrive. Over the past year, SmartDrive has seen the market shift to where fleets, especially mid-size and large enterprises, are now making buying decisions on the basis of what video analytics can do beyond safety and risk management.


Prescriptive intelligence
The presentation by SmartDrive executives covered how the SmartIQ Suite captures and visualizes driver performance data within a workflow designed to help users quickly identify and execute cost-saving opportunities in safety, operations and maintenance.
 SmartDrive transmits critical video and event data to the office for review by fleet managers in near real time.
SmartDrive uses an in-vehicle device called a SmartRecorder to capture streaming video and data from cameras, sensors, electronic control modules and a variety of OEM and third-party vehicle safety systems. The SmartRecorder also can connect with door sensors, ramps, lifts and other electromechanical devices.
The onboard device is loaded with software and algorithms that monitor and interrogate real-time data to find specific patterns of risky driving called “triggers” that lead to collisions. Examples of triggers include U-turns, aggressive, drowsy and distracted driving.
Video and data from these trigger events, as well as granular telematics data for vehicle and driver performance, are transmitted to SmartDrive’s servers in the cloud through cellular or Wi-Fi networks.
Certain trigger events the on-board algorithms and analysis determine to be risky are offloaded for review by driving analysts. The analysts add context for environmental factors and behaviors, like distraction or cell phone use, that contribute to risk. SmartDrive calls the added context “risk observations.”
SmartDrive uses advanced statistics and data science to transform complex event and telematics data into numerical values for every driver and for the overall fleet. The SmartIQ Scores use a numeric scale with a higher score indicating higher risk of collision, and are normalized by amount of hours and miles driven.
“The ability to have very specific numerical values is very powerful,” Mitgang says. “The more granular and specific you can be helps to isolate an opportunity or a problem and then figure out what to do about it.”
The scores are foundational to the SmartIQ Suite. All of the data visualization tools, key performance indicators (KPIs), drill-down reporting and workflow in the suite is customized by user roles in the organization for improving the scores and thus improving driver performance.
 CLICK to enlarge: SmartDrive configures dashboards for each user according their roles. Some are driver coaches that use video and event data to improve performance.
Some managers, for example, play the role of driver coaches and use “game time” film to give context and training to drivers for how to modify their risky behaviors and improve performance in a myriad of areas. Statistics show that driver performance improves by 43 percent, on average, after coaching, says Jason Palmer, president of SmartDrive.
Overall, the SmartIQ Suite is designed to give predictive and prescriptive information to users on what they can do, right now, to make the biggest impact towards achieving company goals in safety, cost reduction and other areas of focus, the executives said.
An explosion of data
SmartDrive grew by 60 percent in 2015 and Mitgang expects growth will exceed 70 percent this year, largely as a result of transportation companies wanting to be better and more efficient at utilizing the “explosion” of data in the industry.
“Just about every one of our recent customers had a non-traditional business problem they were trying to solve with data,” he says.
Nussbaum Transportation, a 300-truck carrier based in Hudson, Ill., began a pilot project with SmartDrive in the spring of 2015 that led to implementing a video safety program fleet-wide starting in July.
Jeremy Stickling, the company’s director of human resources and safety, currently plans to use the expanded capabilities of SmartIQ Suite to dig deeper into driver safety and fuel performance data to further improve results.
Nussbaum developed a Web-based program called Driver Excelerator that collects, analyzes and scores driver performance from a variety of data sources — including those now available from SmartDrive.
The program accurately measures fuel results, for example, by factoring in wind speeds, topography, payload and more. One area where he believes fuel efficiency could be improved further is by grading drivers’ fuel-efficient habits.
With the data and reporting capabilities in the SmartIQ Suite, Nussbaum will be able to measure and benchmark drivers’ habits for acceleration and “smooth driving” to preserve energy and save fuel.
“We can start giving drivers things they can deliver on,” he said.
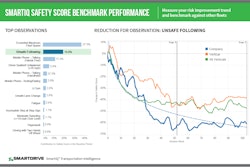
 CLICK to enlarge: Reporting tools in the SmartIQ Suite compare fleet performance to industry peer groups.
Rather than go to a website to get the new metrics, Stickling says Driver Excelerator will be grabbing them through a Web service called SmartIQ Streams. This option in the SmartIQ Suite gives automated data feeds of driver, vehicle and driving performance collected by the video analytics platform.
Playing the role of analyst
The new SmartIQ Suite comes with optional “Pro packs” fit for the emerging role of data analysts at transportation companies.
The online Pro packs leverage Tableau Software to create interactive visualizations and “what-if” analysis using SmartDrive data and advanced analytics.
During the meeting, Slaven Sljivar, vice president of hardware and analytics, demonstrated a number of ways Pro packs can be used to identify savings opportunities. He used actual data from a fleet customer and leveraged the visualizations in Pro packs to build historical, predictive and prescriptive views of data.
One visualization showed how the safety scores of new drivers in the fleet compared to tenured drivers. As expected, new drivers had higher scores. With a few iterations, he changed to a view that showed how much risk the new drivers added to the fleet, and if their scores were better or worse than the previous sets of new drivers.
Osterberg chimed in with a suggestion that carriers could use this capability to compare drivers that came from different CDL schools.
“That is a capability that has been non-existent,” he said. “Now you can focus your recruiting efforts.”
Sljivar then clicked on individual drivers to see why their scores increased or decreased. Some had a problem with texting; others were not wearing seat belts. Immediately, it became clear what each driver needs to do to improve their scores and lower risk.
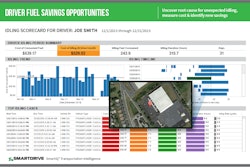
He also demonstrated how quickly an analyst could determine the savings opportunities from reduced engine idling. One view showed that vehicles with excessive idle time consumed an average of $69 in fuel per month. Drilling down further showed company sites that were wasting the most fuel, and geographically where trucks idled the most, and by time of day.
 CLICK to enlarge: One of many data visualizations in the SmartIQ Suite shows the savings opportuny for reducing engine idling.
“If customers wanted to share this information for action, they could PDF this and e-mail it to a driver or send it to a terminal manager,” he said.
Steve Mitgang offered up how an analyst could determine which drivers were causing excessive tire wear by comparing habits in areas like speed cornering or harsh braking.
SmartDrive customers can engage a professional services team of experts to develop custom analytics and visualization through an optional component of the suite called SmartIQ Services.
At several points during the presentation, Don Osterberg talked about how the explosion of data, and products like SmartIQ Suite, will be impacting the next generation of leaders in the transportation industry.
In the past, leaders rose through the ranks by making decisions under uncertainty — by being right more than they were wrong, he said. Today’s leaders will have to transition from this mold of “knowing” leaders into learning leaders.
“I think we all have to open our aperture and recognize the power and value of what has really emerged,” he said. “We have cognitive limitations that technology doesn’t have.”