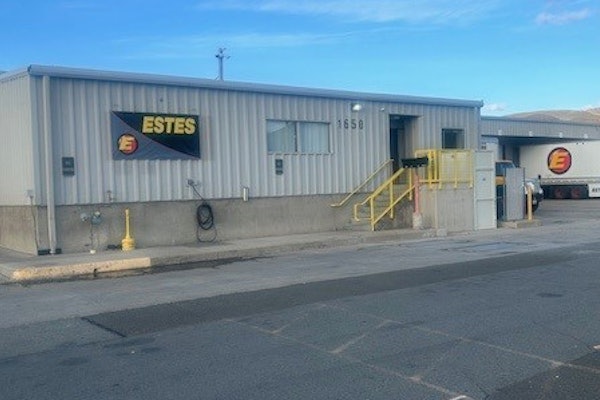
Ruan Transportation’s Chad Johnson (left) manages fleet maintenance data with three levels of reporting: weekly summaries, daily reports and live queries using Microsoft Access.
“You don’t have time to be reactive two weeks or a month down the road,” says Randy Seals, risk manager for Digby Truck Lines, a 375-truck carrier in LaVergne, Tenn. “You need to react momentarily and move the ship any way it needs to be moved.”
Central to success in any business – and especially in a dynamic and competitive industry like trucking – is information management. Some trucking operations do little more with their data than generate monthly or quarterly profit-and-loss statements and other financial reports. They learn how they performed – a couple of months after the fact. But they don’t have tools to determine why. Other trucking executives leverage their historical data by drilling deeper and obtaining insights that guide operational, maintenance and strategic business decisions. And some carriers use sophisticated tools to run complicated “what if” scenarios and even “mine” for trends and relationships that are virtually impossible to detect otherwise.
But even without such robust “business intelligence” tools, many carriers find success through monitoring and measuring performance indicators they find especially valuable and to generate reports on data from multiple databases.
Reporting key indicators
The biggest hurdle in leveraging your data often isn’t getting the data. Rather, the challenge is organizing that data in a format that is useful to you.
All dispatch, accounting and maintenance software systems produce standard reports, such as financial statements, that give users a snapshot of performance during a certain time period. To monitor the many specific factors, such as revenue and deadhead, that “drive your miles” or otherwise affect your revenues and costs on a daily basis, however, requires a higher level of customization.
Management systems typically have file transfer protocol, or FTP, that allows managers to link their “live” database with a spreadsheet. “This reporting functionality allows them to see what they want, when they want it, in formats they are familiar with such as Microsoft Excel,” says Jeff Trattner, director of marketing for TMW Systems. “They can be automatically generated based on user-defined needs – every morning, every third Monday, etc., and include the information they believe to be most important to their type of business.”


Executive Reporting, TMW Systems’ add-on module, comes with about 20 pre-formatted reports in Microsoft Excel templates, but customers can easily customize and create their own, Trattner says.
“With this report, you can get any report you want in any time period,” says Tom Weisz, president of TMW Systems. “You can get a P&L for how you did today. It’s tied into the actual real-time data.” The reporting system is most useful to set up a budget for any metric and compare the actual versus budget. A customer service report, for example, could be set up which shows the percentage of on-time delivery, the reason for being late, and whose fault it was, using an actual versus standards basis.
“It’s so easy, even CEOs can do it,” Weisz says.
Digby Truck Lines, which uses the McLeod LoadMaster enterprise system, transfers data into a spreadsheet. “We look at so much information,” Seals says. “We manage by the numbers. What we try to do is make sure that the people understand what effect each decision makes, and we watch those decisions.”
Seals and others at Digby use Lotus 1-2-3 to print charts with green bars and red bars to compare the actual versus standard measurements in the operations department. The company divides its operations department into different geographical zones and monitors such things as total revenue by zone, deadhead by zone, loads by zone, and rate-per-mile by zone. “We have fun with it,” Seals says. “[Dispatchers] wait each day for us to post them.”
Pay some attention to report frequency. Today’s information technology affords the opportunity to generate daily reports, but that’s not always advisable. FarWest Freight, a 120-truck carrier based in Sumner, Wash., for example, has determined that monitoring profitability on a daily basis could be misleading.
“We have to wait some time for billing to produce the numbers,” says Becki Wolford, FarWest Freight’s chief financial officer. The company pulls data from its Maddocks Software TruckMate 4Win enterprise system into an Excel spreadsheet.
“We monitor the profitability of the loads we are putting together on a weekly basis,” Wolford says. “Some days you’re not going to make as much; you’re going to have ‘loser loads.’ It takes several loads to identify.”
Digging deeper
Standard and customized reports easily answer the most basic management question: How are we doing? Detailed reports can expose the aspects of your business that are adding to the bottom line – and those that are subtracting from it. Even so, static reports can be limited in their ability to tell you why your numbers are what they are.
To pinpoint the problem, you might want information that crosses several dimensions – time (month, first quarter, year to date, etc.), geography, terminal, customer, driver, tractor and so on – simultaneously.
You might want to know, for example, the operating ratio for tractors dispatched to each of a particular customer’s facilities during the first six months of this year compared to the same period last year. Generating such a report might be possible for a true Excel or Lotus whiz, but it would be time consuming. Some basic “business intelligence” systems, such as Crystal Decisions’ Crystal Reports , Cognos’s Impromptu or Microsoft Access, for example, make it easier to generate on-demand reports based on multiple dimensions.
Henry Strause uses Impromptu, in effect, as the direct reporting interface for his McLeod LoadMaster enterprise system – a capability he doesn’t have with Excel. Strause, president of Vance Trucking Co., an 86-truck carrier in Henderson, N.C., says he can use Impromtu to pull up, sort and manipulate data in different rows and columns to create hundreds of reports and different views of data.
Another advantage of some advanced report-writing tools over spreadsheets is that they are Web-based. Users can automate the process of writing, printing and distributing reports to different managers in the company and even to their customers.
QTS, a 400-truck carrier in Sussex, Wis., uses Crystal Reports to generate all of its static, or “canned,” reports, complete with graphs and charts, says Jay Duncan, logistics manager.
The company’s executives and managers can access these pre-built reports – in the Crystal Reports Web server [such as weekly P&L statements and customer revenue reports] – through a password-protected site in the company’s intranet.
The flexibility of advanced reporting tools is especially welcome in maintenance where the number of variables, such as differing brands or specs of components, parts or tools, can be huge.
Chad Johnson, vice president of vehicle maintenance and purchasing for Ruan Transportation Management Systems (RTMS), has access to 238 daily reports from the company’s Maximo fleet maintenance management system from MRO Software. Every week, Johnson reviews summary reports showing exception measurements that fall above or below control levels. Perhaps the company bought more filters this week than usual. Or maybe maintenance schedules are overdue at a specific location.
To dig a bit deeper, Johnson uses Microsoft Access to query the Maximo maintenance database and close in on what might be behind an exception. An extremely useful reporting tool integrated into the database is the Technology and Maintenance Council’s Vehicle Maintenance Reporting Standards, or VMRS, the trucking industry’s common shorthand for equipment maintenance reporting. These reporting standards enable fleets like Ruan to keep maintenance data consistent. For more information on VMRS, see “Maintaining Good Numbers,” CCJ, July 2001).
Asking ‘what if?’
The ability to query data affords the opportunity to “play” with numbers and pinpoint areas of inferior or superior performance. The next level of sophistication is introducing changed assumptions and “running the numbers.” In other words, the next step is asking, “What if?”
Digby Truck Line’s Seals, for example, transfers historical data within LoadMaster’s costing screen – number of loads, revenue, miles, deadhead percentage, average bill amount between any origin and destination points and so on – to a spreadsheet to analyze various customers and lanes and to calculate hypothetical scenarios. “What if I reduced deadhead? Or what if I don’t go to California?” Through building formulas into the spreadsheet, Seals can instantly see what kind of impact an action, such as increasing revenue by X amount in a certain lane would have on the bottom line.
Seals takes weekly and monthly data and breaks it into daily numbers to calculate what would happen if, for example, the company ran five more trucks or ran each truck an extra 50 miles loaded each day or reduced deadhead by 1 percent. A side – or even primary – benefit of such analysis is education. Given the high-volume, low-margin nature of a typical over-the-road trucking operation, you can demonstrate to dispatchers and drivers the impact of small positive or negative changes.
One of the most important uses of “what if” reports, however, is pricing. “We do a lot of regional analysis,” says QTS’s Duncan says. The IT department of QTS uses Crystal Reports to build various on-demand reports from its Maddocks TM4Win enterprise software database to show, for example, the effects on traffic flow and profit if the company adjusted its rates in a particular region.
Mining for intelligence
The capability to test the effects of changed assumptions is a powerful management tool. The ultimate in data analysis, however, is data mining. By analyzing large volumes of enterprise data, data mining can expose patterns or relationships otherwise invisible to management. In other words, you can literally look for something without knowing what you are looking for. For this kind of number crunching, you generally will need robust business intelligence systems like Crystal Decision’s Crystal Analysis, Cognos’s PowerPlay or a transportation-specific solution from GHI Technologies.
“We use [PowerPlay] as a real live interaction tool to make business decisions,” says Tony Pacuraru, vice president of information services for Atkinson Freight Lines, a 171-truck carrier in Bensalem, Pa. For benchmarking purposes, Pacuraru says he uses PowerPlay to produce many “flat” reports, such as a revenue report for each truck. But he also uses PowerPlay on occasion to perform data mining to compare, for example, two different customers or lanes. You may think one is better than the other based on revenue per mile, he says, but data mining has helped uncover the hidden costs.
“You can discover that your backhaul freight is getting you into locations where you have not been taking all expenses into consideration,” Pacuraru says. “You know that it costs a certain amount to run a truck in a lane for a customer, but there is a hidden cost of what it took to get the truck there.”
The software to do this kind of analysis could cost thousands of dollars to implement if purchased straight off the shelf. Through partnerships with providers of enterprise software companies, however, the price can become very manageable. McLeod Software, for example, resells Cognos’ PowerPlay product for its LoadMaster enterprise for $895 and also provides programming support for the product.
“We have some users who use the tool tremendously,” says Tom McLeod, president of McLeod Software. “But using a tool like that depends on the company having somebody on site who has the time and computer literacy to jump in and get the data out. It can be a real asset.”
Maddocks Software and GHI Technologies formed a partnership to make GHI’s transportation solution available to Maddocks’ customers through an application service provider arrangement. That approach makes data mining more affordable and more accessible to trucking executives. “If you look at the cost of data mining products it is very, very expensive, and the typical trucking client doesn’t have an IT staff to manage another database,” says Bob Maddocks, president of Maddocks Software.
Whether you can benefit from advanced business intelligence software depends on the scope and complexity of your operation and the computer skills of someone within your company. No matter how small or technologically challenged your operation is, however, you can at least spend some time playing around with a spreadsheet to improve your bottom line.