The third quarter earnings report season provided a generally positive outlook on the financial health of large truckload carriers, with a few companies putting up very nice gains from a year ago – and a year ago, things were pretty good.
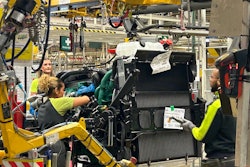
The carriers were equally sure of one thing: The industry must find more drivers to grow. Those that did, unsurprisingly, showed the most improvement. Tight capacity continues to support rate increases for all.
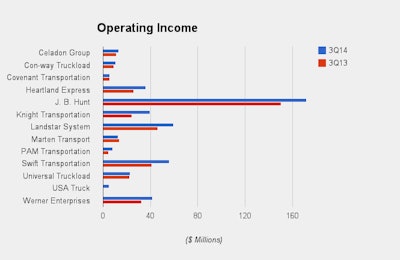
Below are interactive charts (move the cursor to a colored line for the precise total) putting the second-quarter corporate results head-to-head, along with a roundup of some executive commentary.
(NOTE: Companies vary in the measures they report and the way they calculate them; complete information, as published, may be found in the Investor Relations section of the publicly traded carriers’ websites. Also, Con-way Truckload is part of Con-way Inc. (No. 5 on the CCJ Top 250), but the company breaks out several key TL metrics in its quarterly reports. These are included here for comparison.)
Heartland’s (No. 28 on the CCJ Top 250) operating revenues showed the biggest jump from the 2013 quarter, increasing 67.5 percent primarily due to increased miles associated with the acquisition of Gordon Trucking Inc. (No. 58 on the CCJ Top 250 in 2013) a year ago. The company reports that the third quarter saw the complete integration of GTI operations into the central information technology platform, with should lead to further efficiency improvements.
Swift (No. 3 on the CCJ Top 250)gets the last laugh, at least for the third quarter. After its stock price took a beating after the Q2 earnings release – based on the company’s lower than expected earnings projection for the Q3 – the price jumped up again following a better than expected report.
Even though Swift posted nice gains on the disposal of property and equipment, good improvement in the truckload segment’s operating ratio prompted Stifel to upgrade its stock recommendation.
“Improving margins, customer rate increases, lower driver turnover, as well as more stability around Dedicated start-up costs and Central Refrigerated integration costs have set the company up to improve performance in 4Q14,” Stifel’s John Larkin says. “We think most of the major, unanswered issues are behind us.”
USA Truck (No. 50 on the CCJ Top 250) posted a profit for the second consecutive quarter after three years of losses, thanks to strong demand and a much better consolidated operating ratio. While an OR of 99.9 is nothing to brag about, a 450 basis point improvement certainly adds to the bottom line.


“We reached a key milestone in our turnaround plan by bringing Trucking’s operating ratio under 100, and we intend to continue that trend,” said President and CEO John Simone.
With drivers hard to come by, any gain is noteworthy.
“We increased our average truckload tractors by 70 tractors in the third quarter over this year’s second quarter despite challenging driver recruiting and retention issues across our industry,” Marten Transport (No. 46 on the CCJ Top 250) Chairman and CEO Randolph L. Marten said. “This increase was a direct result of our continuing efforts to increase our dedicated services and to appropriately compensate our drivers for their non-driving detention time. We also overcame the increase in driver pay combined with higher tractor and trailer depreciation and adverse development in insurance and claims to improve our truckload profitability.”
Covenant’s (No. 40 on the CCJ Top 250) average freight revenue per tractor per week surged 11.8 percent compared to the third quarter last year, contributing to record-breaking earnings. Broken down differently, Covenant reported their average freight revenue increased by 10.1 cents per mile (or 6.7 percent) compared along with a 9.9 percent increase in average length of haul. Average miles per unit increased by 5.7 percent.
“The main factors impacting the improved utilization were a 420 basis point increase in the percentage of our fleet comprised of team-driven trucks, a tighter overall freight network and a higher seated truck percentage,” said Chairman, President and CEO David R. Parker. “On average, approximately 5.1% percent of our fleet lacked drivers during the 2014 quarter compared with approximately 5.7 percent during the 2013 quarter.”
At Knight (No. 26 on the CCJ Top 250), improved empty miles for the quarter was just one of the metrics contributing to a 16.3 percent increase in revenue compared to the year before.
“The overall demand environment remained strong while capacity continues to be tight. We are pleased with the progress made in both our trucking and logistics segments, as these businesses continue to complement each other and have led to profitable growth,” said Kevin Knight, chairman and outgoing CEO. “In our trucking business, revenue per tractor, excluding fuel surcharge, increased 7.2 percent, year over year, with a 6.5 percent improvement in revenue per loaded mile, a 2.5 percent increase in our length of haul, an 80 basis point improvement in our non-paid empty mile percentage and miles per tractor essentially flat.”
Also, Knight acquired Barr-Nunn Transportation (No. 187 on the CCJ Top 250) during the reporting period, but the third quarter results do not include any revenue or earnings related to post-merger operations.