Improving productivity and efficiency always has been necessary for a fleet to survive. Today, more than ever, fleet executives and managers need to make decisions at the moment – and perhaps even before – events happen. Fleets seldom lack data, but waiting days or weeks to analyze performance and make corrections is not an option.
In the second installment of CCJ’s “Big Data” series, we look at how business intelligence can help fleets navigate increasingly complex and large data sets and get fast, reliable insights into business performance.
“We measure everything,” says Braxton Vick, senior vice president of corporate planning for Southeastern Freight Lines. “As a result, we have to come up with better ways to portray and translate that into information people can use.”
With BI, companies can extract data from multiple sources into a single database for analysis. In most cases, the analysis takes place automatically behind the scenes, and results are distributed quickly to users at all levels via “dashboards” and familiar office tools. Here are five ways for using these latest advancements for continuous improvement.
1. Sizing up drivers
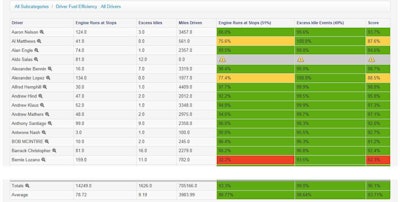
Onboard computers and mobile communications systems capture a wide range of data from vehicles, such as mpg, idle time, speeds and safety events. By using scorecards and other BI tools, managers quickly can prioritize the information and take action.
 Cadec’s Performance Management Scorecards provide fleet managers with an intuitive easy-to-read report on driver behavior based on key performance indicators that highlight issues such as speeding, idling, overrevving or sudden decelerations.
Saia LTL Freight’s fleet managers receive a report of key metrics presented in Excel with options to drill down each metric by area, region, terminal, driver and other categories to find specific areas to focus on improving.
The Johns Creek, Ga.-based LTL carrier operates 3,400 tractors and 147 terminals. With its BI platform, fuel efficiency performance can be viewed from a variety of different angles, such as mpg by equipment model or by driver, along with patterns for idling and shifting.
Saia LTL Freight used one data element – the percentage of shifts within the optimal rpm range – to increase training and awareness of progressive shifting techniques. “The higher the batting average in the sweet spot, the greater the results,” says Brian Balius, vice president of linehaul and industrial engineering.
Besides improving fuel economy, Saia LTL Freight has been able to use its BI platform to make measureable improvements in on-time service, shortage and damage frequency, load average and accident frequency measures, among other metrics, Balius says.
About eight years ago, Cadec developed a scorecard-style report for its mobile fleet management system called “GYR” for green, yellow and red. The report showed a snapshot of driver performance trends for a specified time period. GYR used weighting so that events that were deemed higher risk – such as rapid deceleration or activation of the rollover stability control system – became visible immediately.
When Cadec released its current PowerVue platform, the GYR report became a real-time BI scorecard that now includes a full array of safety, supply chain performance and productivity elements.
“It is way more dynamic and real time for metrics that merit real-time scorecarding,” says Owen Smith, senior vice president of product strategy. The scorecard normalizes the data based on factors such as miles, engine hours and stops. Each category is weighted as to what is most important to the total composite score.
CarrierWeb recently created a dynamic reporting tool to compare driver route performance against company standards. Users quickly can find all drivers and vehicles that ran a designated route for a certain time period. Drivers that exceeded standards or the average for speeds, stop times, fuel economy and other metrics are identified with color-coding.
Qualcomm offers a variety of BI tools through its Analytics Manager application. Fuel, safety, compliance and other driver efficiency metrics are pulled into a central database for reporting. Users can see performance summaries and drill down to specific events.
Scorecards can be created for monitoring groups and individual drivers. Since Analytics Manager is a cloud-based system, users also can compare mpg and other metrics with data aggregated from other Qualcomm customers.
Rand McNally has a new dashboard in its Connect Web portal that is part of its TND 760 and TPC 7600 mobile fleet management systems. The dashboard view shows trends and key performance indicators. Fleet managers can drill down into business issues via detailed reports that can be exported to Excel for further analysis.
Click here to see Part 2.


