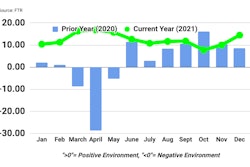
The year 2021 should go down in history books as a massive one for the trucking and logistics industry, as a majority of the companies on this list reported some type of record for revenue or income despite a challenging environment marked by labor and equipment shortages as well as regulatory uncertainty. While many predicted that vaccine mandates, or COVID itself, would dampen driver availability or demand itself, 2021 proved that the trend towards goods and not services in personal consumption had some staying power.
Take a look at the big carrier earnings below to get an idea of what went down in 2021.
Covenant slips compared to last quarter, but still finds traction
Covenant Transportation (CCJ Top 250, No. 38) hit its goal of bringing in more than $1 billion in revenue this year and setting a company record, but its revenue and income both dipped slightly from Q3 in yet another sign of seasonality perhaps fading from the market. Covenant reported a slight miss on margin goals within its Warehousing segment and attributed that to high rents and labor costs on a new facility. The company's Expedited and Dedicated segments were "negatively impacted by approximately 250 basis points primarily related to catch-up vesting of prior year performance-based compensation due to our record results, incremental costs to secure short-term capacity to service short-term freight commitments and a lack of gain on sale due to delays in equipment deliveries," though it does not expect those trends to continue into 2022.
“Our asset-based segments, Expedited and Dedicated, contributed approximately 58% of total revenue in the quarter and performed well in an environment characterized by strong freight demand, an extremely competitive driver market, workforce volatility due to COVID-19, and rising costs. Our Expedited segment grew revenue and produced adjusted margins similar to the fourth quarter last year, with improved pricing and utilization overcoming significant driver pay increases and a smaller available fleet. We also implemented multi-year contracts with certain major customers that should lessen the impact of economic cycles on this segment. Our Dedicated segment improved year-over-year and sequentially by producing higher revenue and better margins, progress needed to meet our targeted returns," Covenant Chairman and Chief Executive Officer, David R. Parker, continued.
Revenue: 2021 YTD: $1 billion vs. 2020 YTD $838.5 million


2021 Q4: $267 million vs. 2020 Q4: $210.8 million
Income: 2021 YTD: $67.1 million vs. 2020 YTD: ($14 million)
2021 Q4: $18.2 million vs. 2020 Q4: $9.6 million
–
Forward Air Corporation increases weights, not just rates
Forward Air Corporation (CCJ Top 250, No. 50) managed to spend $16 million on new equipment and property despite scarce trucks and high rates for commercial real estate. The company set records for revenue and income, which it credits to not just getting better rates, but actually increasing tonnage.
"With higher quality freight in our network, our less-than-truckload line of business reported record levels in weight per shipment and revenue per shipment for the fourth quarter. Our solid growth strategies combined with continued strong demand for our services drove our record fourth quarter revenue growth of 31%, which came in above the high end of our guidance range of 23% to 27%. Our record reported net income per diluted share of $1.40 exceeded the high end of our $1.25 to $1.29 guidance range,” Tom Schmitt, Chairman, President and CEO said. “We anticipate solid performance in the first quarter of 2022 with volumes expected to exceed the same period of 2021. For the month of January, our revenue per shipment increased 54.8%, weight per shipment increased 33.0% and tonnage increased 10.7% year-over-year. Based on the continued precision execution of our strategic priorities, at this moment, we are ahead of pace toward our previously announced full year 2023 targets.”
Revenue: 2021 YTD: $1.6 billion vs. 2020 YTD $1.2 billion
2021 Q4 $459.9 million vs. 2020 Q4: $350.3 million
Income: 2021 YTD: $159.3 million vs. 2020 YTD: $73.9 million
2021 Q4 $51.9 million vs. 2020 Q4: $20.7 million
–
Heartland Express gets creative with compensation packages
Heartland Express (CCJ Top 250, No. 42) reported in Q4 a slight drop in revenue compared to 2020 despite a $6.7 million increase in fuel surcharge revenues, but a major improvement in profits overall. Overall, Heartland Express Chief Executive Officer Mike Gerdin highlighted the company's consistency throughout rapidly changing times and the company's improved operating ratio.
"“Throughout 2021, freight demand was strong and we were able to capitalize on rising freight rates and better utilization across our operating fleet. 2021 was an extremely challenging year for hiring and retaining professional drivers. We implemented creative compensation packages and driving opportunities to better attract and retain drivers. We believe this will allow us to better compete for the shrinking pool of qualified and safe professional drivers across our industry. As a result, the operating results delivered were an operating ratio of 82.1% and 79.2% Non-GAAP Adjusted Operating Ratio(1) for the three months ended December 31, 2021 and an 82.6% and 80.2% Non-GAAP Adjusted Operating Ratio(1) for the past twelve months. At the core of our operating philosophy remains a 40+ year target of a low 80's operating ratio and the results delivered in 2021 have exceeded this goal. Looking forward, we expect more of the same from the freight environment with strong demand for goods across the board in 2022. Increasing costs are expected to continue to drive increasing freight rates throughout the year. Further, we believe that the expected environment in 2022 will continue to be a challenge for supply chains but should reward carriers who operate from a strong financial position," said Gerdin.
Revenue: 2021 YTD: $607.3 million vs. 2020 YTD: $645.3 million
2021 Q4: $148.1 million vs. 2020 Q4: $155.7 million
Income: 2021 YTD: $105.4 million vs. 2020 YTD: $103.4 million
2021 Q4: $26.5 million vs. 2020 Q4: $23.7 million
–
J.B. Hunt cashes in by sourcing capacity while rates soar
J.B. Hunt (CCJ Top 250, No. 3) saw an 85% jump in revenue from its truckload as it was able to "source capacity for customers by leveraging the talents and skills of our people and our investments in technology across the organization, including the Marketplace for J.B. Hunt 360°®," according to a release. The company managed a strong quarter despite challenges "from both rail and customer activity" and increases in employee bonuses, driver wage and recruiting costs, rail and truck purchase transportation expenses, and non-deriver personnel salary.
The company saw a slight decline in intermodal volumes, mostly due to declining transcontinental load volumes, which it chalked up to rail restrictions, customer detention of equipment, weather events and derailments, and labor challenges. But even counting for the slight dip in volume, revenue increased 30% per load as rates soared.
Revenue: 2021 YTD: $12.2 billion vs. 2020 YTD: $9.6 billion
2021 Q4: $3.5 billion vs. 2020 Q4: $2.7 billion
Income: 2021 YTD: $1 billion vs. 2020 YTD: $713.1 million
2021 Q4: $322.5 million vs. 2020 Q4: $207.7 million
–
Knight-Swift Transportation's sees profits spike
Knight-Swift Transporation Holdings Inc. (CCJ Top 250, No. 4) saw net income jump 78.9% year-over-year in Q4 of 2021 as rates soared and capacity tightened. The company acquired Midwest Motor Express in December in a bid to increase it's LTL network. For a second quarter in a row, the company's logistics segment saw more than 130% growth, which the company partly attributes to a fleet of 70,000 trailers for power-only service offerings.
"Our success in the truckload market has enabled us to make significant strategic investments for future growth," Dave Jackson, CEO of Knight-Swift, said in a release. "We are building a nationwide LTL network with current regional coverage in the Southeast and Northwest with $927 million in annualized total revenues. We believe our pattern of preserving local culture and relationships while leveraging the network, scale, and technology of Knight-Swift will continue to be successful in growing LTL as it has been in full truckload. We have invested significant resources into building our freight platform which is creating value for our customers, in the form of additional trailer-pool capacity, and to our smaller partner carriers who desire to participate in our network. This platform is a combination of our proprietary technology, sizeable diverse freight network, partnerships with small carriers, and the truckload industry’s largest trailer fleet. Evidence of the success and growth includes the 84.0% load count growth and 20.7% gross margin in our Logistics segment."
Revenue: 2021 YTD: $5.5 billion vs 2020 YTD: $4.4 billion
2021 Q4: $1.7 billion vs. 2020 Q4: $1.2 billion
Income: 2021 YTD: $724.8million vs. 2020 YTD: $410 million
2021 Q4: $254.6 million vs. 2020 Q4: $142.3 million
–
Landstar sets revenue record with 50% jump
Landstar System, Inc. (CCJ Top 250, No. 9) reported record quarterly revenue of almost $2 billion, a 50% jump from the $1.2 billion in Q4 of 2020 as operating income increased at an even greater percentage to nearly $150 million from $84 million in Q4 2020. The company plowed that record profit into share buybacks, purchasing about 417,000 shares of its common stock.
“Fourth quarter truck loadings increased from the 2021 third quarter by 7 percent, the largest ever increase in truck loadings from the third quarter to a 13-week fourth quarter in Landstar history. Our 2021 fourth quarter performance was particularly impressive considering we were following an already record-setting third quarter, and, in most years, load volume hauled by truck stays relatively flat sequentially from the third quarter to the fourth quarter. We attribute this unseasonal increase in volume to ongoing, broad-based demand for freight transportation services, with particular strength in sectors benefiting from consumer spending that, similar to the rest of 2021, continued to be a big driver of freight activity.”,” said Landstar President and CEO Jim Gattoni.
Revenue: 2021 YTD: $ 6.5 billion vs. 2020 YTD: $4.1 billion
2021 Q4: $1.9 billion vs. 2020 Q4: $1.3 billion
Income: 2021 YTD: $721 million vs. 2020 YTD: $443.4 million
2021 Q4: $209.8 million vs. 2020 Q4: $141.6 million
–
Marten Transport keeps on trucking
Marten Transport (CCJ Top 250, No. 13) saw its net income jump more than 20% both year over year and compared to last quarter while operating revenue hit a record $266.9 million in the quarter. The company saw strong growth in its reefer and dry van business. Perhaps due to a shortage of new trucks, high prices for used ones, and expensive commercial real estate the company only added $26 million worth of revenue equipment, buildings and land, and other assets since the end of 2020.
Executive Chairman Randolph L. Marten only said, “Marten’s bright and determined people consistently produce strong profitable growth, to be continued."
Revenue: 2021 YTD: $973.6 million vs. 2020 YTD: $874.3 million
2021 Q4: $266.9 million vs. 2020 Q4: $227.3 million
Income: 2021 YTD: $111.7 million vs. 2020 YTD: $93.2 million
2021 Q4: $30.7 million vs. 2020 Q4: $25.6 million
–
Old Dominion staffs up while riding LTL boom
Old Dominion (CCJ Top 250, No. 10) saw its fourth straight quarter of double digit revenue growth as it continued to invest in increasing its capacity to grow its market share in the LTL segment. Despite a massive hiring blitz, the company said it had lowered its labor costs in relation to revenue.
"“Our revenue growth for the fourth quarter was primarily due to a 16.1% increase in LTL revenue per hundredweight and a 14.3% increase in LTL tons per day. The increase in our LTL tons included a 17.5% increase in LTL shipments per day that was partially offset by a 2.7% decrease in LTL weight per shipment," said Greg C. Gantt, president and CEO of Old Dominion. "Our salaries, wages and benefit costs as a percent of revenue improved to 46.9% from 50.7% in the fourth quarter of 2020, which more than offset the increases in expense for both operating supplies and purchased transportation. Our average number of full-time employees increased 20.3% during the fourth quarter, and we intend to hire additional employees in 2022 to support our anticipated growth. In addition, we expect to continue to utilize purchased transportation to support the capacity of both our people and our fleet during 2022,"
Revenue: 2021 YTD: $5.2 billion vs. 2020 YTD: $4 billion
2021 Q4: $1.4 billion vs. 2020 Q4: $1.1 billion
Income: 2021 YTD: $1 billion vs. 2020 YTD: $652.5 million
2021 Q4: $372.5 million vs. 2020 Q4: $254.3 million
–
P.A.M. Transport doesn't get all its builds
PAM Transport (CCJ Top 250, No. 58) saw a strong quarter despite a lawsuit settlement and OEMs not fully delivering. The company said that in 2021 it rceieved approximately 60% of the equipment it ordered and now expects the remaining deliveres in "early 2022." Last quarter, PAM's earning release told a similar story. That said, the company saw massive gains in revenue and income, suggesting it's cashing in on high rates and figuring out how to stretch existing equipment. The average ages of truck and trailer fleets were 1.8 years and 5.5 years at the end of 2021, up from 1.4 years and 4.9 years at the end of 2020.
“We made significant progress in the quarter and in 2021 at PAM with profitable organic growth, President Joe Vitiritto said in a press release. “The growth has allowed our team to offer creative capacity solutions to our customers in unprecedented times.”
Revenue: 2021 YTD: $641.3 million vs. 2020 YTD: $438.9 million
2021 Q4: $213.9 million vs. 2020 Q4: $142.8 million
Income: 2021 YTD: $100.2 million vs. 2020 YTD: $33.9 million
2021 Q4: $34.7 million vs. 2020 Q4: $16.3 million
–
Schneider National enjoys a boom in its logistics segment
Schneider National (CCJ Top 250, No. 8) lstruggled in with a lower truckload network fleet count and a decrease in miles per tractor due to "industry-wide capacity and supply chain constraints," but still rode sky-high rates to a 11% increase in truckload revenues and a 35% jump in profits. The company's logistics segment saw the greatest increase, with a 46% increase over 2020. The company projected its dedicated revenues would reach $1 billion in 2022 after it acquired Midwest Logistics Systems, Ltd.
“As we look ahead, we anticipate that the supply and demand conditions experienced in 2021 will extend well into 2022,” Mark Rourke, Chief Executive Officer and President of Schneider commented. “We expect continued capital allocation toward both organic and inorganic growth opportunities to further differentiate our platform.”
Revenue: 2021 YTD: $5.6 billion vs. 2020 YTD: $4.6 billion
2021 Q4: $1.6 billion vs. 2020 Q4: $1.3 billion
Income: 2021 YTD: $533.7 million vs. 2020 YTD: $286.7 million
2021 Q4: $178 million vs. 2020 Q4: $106.3 million
—
USA Truck makes the most out of every tractor
USA Truck (CCJ Top 250, No. 68) saw an increase in deadhead percentage and a dip in loaded miles per available tractors after adding just 11 tractors since Q3 of 2021. That said, the business' trucking segment saw a 14.6% jump in revenue, nearly double the income, and an operating ratio of 90.3% in the segment. The company attributed thes stats to a nearly 20% jump in base revenue per loaded mile. The company's logistics segment saw a 44.9% improvement over Q4 2020 by showing a higher load count and greater revenue per load.
President and CEO James Reed commented, ““The company transformation that we have discussed over the last several years has yielded our sixth straight quarter of record adjusted earnings per share. The fourth quarter and full year 2021 represent our highest total revenue and adjusted earnings per share(a) in the Company’s history.
During the fourth quarter, continued execution on our strategic initiatives, operational strategy and a strong freight and pricing market resulted in a Trucking segment adjusted operating ratio(a) improvement of 440 basis points year over year to 88.7%. Our USAT Logistics segment provided a 23.4% increase in load volume with operating revenue up 44.9% year over year.”
Revenue: 2021 YTD: $441.1 million vs. 2020 YTD: $384.2 million
2021 Q4: $119.5 million vs. 2020 Q3: $104.2 million
Income: 2021 YTD: $22.6 million vs. 2020 YTD: $9.3 million
2021 Q4: $11.6 million vs. 2020 Q4: $6.4 million
–
U.S. Xpress dragged down by Variant
U.S. Xpress (CCJ Top 250, No. 16) saw its tech-focused subsidiary Variant crash and burn in Q4, when the company enjoyed solid growth in revenue but suffered a $5 million loss because of its play to establish a tech-focused fleet.
“We built Variant purposely outside of US Xpress with a team that had technology expertise, but not necessarily trucking expertise, and provided them with a mandate to build a technology-enabled fleet. For most of Variant’s history, this framework was successful, as the fleet grew rapidly and produced a better experience for drivers and customers while enhancing utilization, safety, and revenue per tractor. However, as Variant began to achieve significant scale, we found that the team needed to shift their focus from idea generation to execution to ensure that the fleet ran smoothly while maintaining its superior operating metrics. To achieve this shift, I have brought together the technology and operations teams reporting directly to me as we work collaboratively to get back on track in 2022. Since mid-December, the operational changes that we have made have translated to improvements in utilization, revenue per tractor and overhead per tractor," said U.S. Xpress President Eric Fuller.
Revenue: 2021 YTD: $1.9 billion vs. 2020 YTD: $1.7 billion
2021 Q4: $531.6 million vs. 2020 Q4: $455.6 million
Income: 2021 YTD: $18.4 million vs. 2020 YTD: $43.6 million
2021 Q4: ($5.1 million) vs. 2020 Q4: $15 million
–
Werner cuts contractor miles and still comes out ahead
Werner (CCJ Top 250, No. 40) saw strong growth in revenue and income while cashing in on high freight rates and selling used equipment in a pricey market. The company did have to battle "inflationary cost increases for driver pay and benefits, driver sourcing, equipment maintenance, and insurance and claims," but still came out ahead in its Truckload Transportation Services segment, which saw a $9.6 million increase in operating income. The company also boosted copany truck miles by 600,000 while slashing 5.3 million independent contractor miles.
Derek J. Leathers, Chairman, President and Chief Executive Officer said, “Despite severe capacity challenges across our industry, we grew our truckload fleet and our logistics business with expanded capacity solutions to better serve our winning customers during fourth quarter.
Revenue: 2021 YTD: $2.7 billion vs. 2020 YTD: $2.3 billion
2021 Q4: $765.2 million vs. 2020 Q3: $620.3 million
Income: 2021 YTD: $309.1 million vs. 2020 YTD: $227.4 million
2021 Q4: $98.5 million vs. 2020 Q4: $81.5 million
–
XPO Logistics sets a revenue record while growing brokerage reach
XPO Logistics (CCJ Top 250, No. 6) posted record revenue and EBITDA numbers in Q4 of 2021 thanks to its strong performance in the desirable LTL and Brokerage segments, which brought in $1 billion and $2.4 billion respectively. The company continued to push its "action plan" to improve its operating ratio in the LTL market, which includes getting new drivers and facilities in. Overall, the company's investment in the XPO Connect brokerage platform appears to have paid off as the brokerage showed growth in load numbers while other LTL operators saw LTL tonnage and shipments decrease.
“Our North American truck brokerage business is continuing to far outpace industry growth, propelled by our XPO Connect digital brokerage platform. This technology was a major tailwind behind the 29% load growth we achieved in 2021 year-over-year, including 35% load growth from our top 20 customers. In the fourth quarter, 70% of our brokerage orders were created or covered digitally. We expect to continue to deliver double-digit volume growth in North American truck brokerage in 2022 and going forward," Brad Jacobs, chairman and chief executive officer of XPO Logistics, said.
Revenue: 2021 YTD: $12.8 billion vs. 2020 YTD: $10.2 billion
2021 Q4: $3.4 billion vs. 2020 Q4: $2.9 billion
Income: 2021 YTD: $616 million vs. 2020 YTD: $228 million
2021 Q4: $174 million vs. 2020 Q4: $153 million
–
Yellow Corporation does more with less in LTL
Yellow Corporation (CCJ Top 250, No. 5) saw a 10% drop in LTL tonnage per workday, and a nearly 8% drop in LTLT shipments per workday, but every LTL revenue metric went up double digits thanks to strong rates. Additionally, the company's large capital expenditures went to updating the fleet and pushed the use of purchased transportation down to 14.5% in Q4 2021.
“Yellow concluded one of the largest capital expenditure plans in its history this year that included investments in tractors, trailers, technology, box trucks, containers, liftgates and other assets. The high level of reinvestment began in the fourth quarter 2020 and through the end of 2021 approximately 17% of the tractors and 9% of the trailers in the fleet have been upgraded. The newer tractors will run the highest number of miles in the fleet, fully leveraging the environmental benefits. Compared to the tractors that are being replaced, the newer units are approximately 30% more fuel efficient and that is expected to result in a corresponding reduction in CO2 emissions," Darren Hawkins, Chief Executive Officer, said.
Revenue: 2021 YTD: $5.1 billion vs. 2020 YTD: $4.5 billion
2021 Q4: $1.3 billion vs. 2020 Q4: $1.2 billion
Income: 2021 YTD: $55.8 million vs. 2020 YTD: $13.7 million
2021 Q4: $103.6 million vs. 2020 Q4: $56.5 million