CCJ Innovators profiles carriers and fleets that have found innovative ways to overcome trucking’s challenges. If you know a carrier that has displayed innovation, contact CCJ Editor Jeff Crissey at [email protected] or 800-633-5953.
 At U.S. Xpress, Gerry Mead, senior vice president of maintenance, and Jeff Seibenhener, chief information officer, worked together to create a true lifecycle costing and management system for assets.
Gerald (Gerry) Mead can monitor the key performance metrics of his job at any time, inside or outside the office. He pays especially close attention to the number of trucks in the shop beyond their promised due dates.
This type of information was not available to Mead when he came to work for U.S. Xpress 3½ years ago. At the time, the Chattanooga, Tenn.-based truckload carrier (CCJ Top 250, No. 14) had plenty of information, he recalls, but “you had to go to people and ask for it.”
About three years ago, U.S. Xpress began to apply Lean and Six Sigma management practices throughout the organization. As senior vice president of fleet maintenance, Mead joined a steering committee of executives responsible for selecting projects and providing direction for continuous improvement initiatives.
The Continuous Improvement steering committee wanted to eliminate the “time wasters” and “lag points” that were keeping trucks on the sidelines. However, the time and effort it took to identify which trucks were in the shop on any given day, and how long they had been sitting, was “beyond enormous,” he says.
This and other shortfalls in reporting information were a result of having disparate IT systems and databases. Another problem: The information being shared among departments lacked standard definitions.
A report might show the number of “dispatched” and “not dispatched” trucks. The same terms had different meanings to people in operations and maintenance, and it wasn’t always clear who was responsible to get “not dispatched” trucks moving.
“Everyone had their own things going on,” says Mead.
Working with the CIO
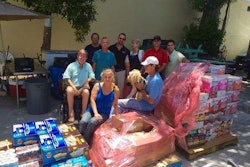
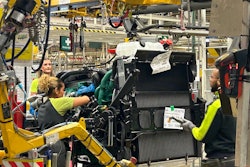
 The business intelligence scorecards used by U.S. Xpress were developed by cross-department team members. The team that developed the Tractor Velocity scorecard included Max Fuller, chairman and CEO (third from left).
In 2015, Mead began working with Jeff Seibenhener, U.S. Xpress’ chief information officer, as part of the continuous improvement efforts. With other resources and brain power, they initiated a project to consolidate and centralize the reporting of real-time metrics to determine the true lifecycle cost of the fleet’s assets.


By late 2015, the team had laid the groundwork for a new business intelligence system with next-level capabilities.
The project’s scope was more complex than accounting for the acquisition, depreciation and disposal costs of tractors and trailers. It had to include all of the pertinent metrics for asset availability, utilization, velocity, throughput and more, Mead says.
“We have a really good relationship and so do our teams,” Seibenhener says of Mead. “That is part of how we were able to work together so closely and leverage the things we needed to solve this problem.”
To develop the system, Seibenhener and his IT department used the Microsoft BI stack to create a data warehouse, data cubes and analytical processes that take transactional data from various sources and transform it to smart, fast and consumable information.
In addition to developing the new software, Seibenhener and Mead also had to get the stakeholders in operations and maintenance to agree on standard definitions for data.
“The meetings were pretty intense to get down to whose definition was ‘right’ and whose was ‘wrong,’ ” Mead says.
Once the definitions were settled and all of the necessary information was in one place, the company began to drive new efficiencies “by not continuing to operate in silos,” he says.
Business intelligence
 The Standard Repair Times report shows how efficiently the shops are completing repairs. Each type of repair is represented by an icon and is colored green, yellow or red depending on how the average repair time is trending.
The new BI application’s user interface consists of a portal with various reports. The interface was developed using a Microsoft Sharepoint dashboard and report center, Seibenhener says.
All of the reports in the BI portal came from Rapid Improvement Events in the Lean Six Sigma structure and were facilitated by a “blackbelt” who brought together cross-functional resources from different departments, explains Paula Logan, vice president of continuous improvement at U.S. Xpress.
Hover boxes are used in all reports to show users the formula and definitions of the values in each row and column. By doing this, there is never any guessing about what each value means and how it is derived, Seibenhener says.
A Tractor Velocity Report shows the number of “Dispatched” and “Available” trucks, among many other metrics. The report is used in a number of ways to increase asset utilization.
Mead used the live report on Jan. 11 as an example. “I see that our dedicated division has 55 trucks available, unseated, for an average of 136 hours,” he says. “When (operations) are hollering for trucks, I can say ‘Timeout. You already have trucks. You just need to go get these trucks.’ ”
As with other reports in the portal, the Tractor Velocity Report separates metrics into different sections or buckets. Each uses a different color to represent the person who is responsible for the metrics.
All of the reports have a button in the top-right corner that says: “USAGE last 7 days.” Clicking on this shows how frequently employees have used the report to drive accountability.
 U.S. Xpress created a Shop Ledger report to gain visibility to the status of equipment down for repairs.
One section in the Tractor Velocity Report is “Unseated Trucks—Shop.” Two of the metrics here show the number of trucks in U.S. Xpress’ dedicated and over-the-road divisions that have been in the shop for more than 24 hours. Users can drill down to find out why the trucks are in the shop and take actions to improve efficiency.
Another report, Standard Repair Times, shows how efficiently the shops are completing repairs. Each type of repair is represented by an icon that is colored green, yellow or red depending on how the average repair time is trending in relation to the fleet’s SRT.
By clicking on the icon for battery repair, a user could drill down to see the technicians that exceeded the SRT, along with their location and other details. The report also shows trends that need to be addressed.
“Our training manager uses this to make a training plan for each quarter,” Mead says.
Changing PMs
One of the most important reports for Mead shows failures that occur between preventive maintenance events. The company currently is 92 percent efficient, meaning only 8 percent of its trucks are returning to shops between PMs.
Mead and others have used this report to make 24 adjustments to its PM services to significantly reduce downtime and maximize efficiencies.
One report automatically notifies fleet managers when their trucks are 5,000 miles away from a scheduled PM. The report color-codes trucks in yellow when they are due for service in 2,500 miles. Trucks grouped in red are overdue, and managers are expected to get them to a shop within 24 hours.
 The team that developed the Standard Repair Times report at U.S. Xpress: (L to R) Matt Wells, Brandy Kelly, Bobby Allen and Steve Goodner.
The maintenance department also uses a BI report that identifies failure trends based on mileages, driver seniority and vehicle specification. The report helps to determine which parts should be replaced during a PM service before they fail. For example, U.S. Xpress recently began replacing a shock on a certain vehicle spec, Mead says.
The results
Benefits of the BI system have been widespread. One result is a dramatic increase in response time during the last 18 months. Fleet maintenance has reduced its average wait time to answer a phone call to less than two minutes, Mead says.
When drivers and vendors call to report a breakdown or to approve a purchase order, transactions are happening quickly to keep trucks moving.
Overall, the average number of days that trucks are in the shop following an accident has dropped from 30 days to under seven days. The average time that trucks are in shops for repairs has decreased from more than seven days to 3½ days, Mead says.
With a fleet of 7,000 trucks, the number of trucks with overdue PMs is in the single digits. With these and other continuous improvement projects, U.S. Xpress has increased asset utilization and generated millions in extra revenue, he says.
“We are seeing more collaboration, relationship-building and teaching of others throughout the organization,” says Seibenhener of the continuous improvement efforts.