CLICK on the map to view zip codes with the highest drug positivity test rates for workers.
Newly released data show that trucking and other safety-sensitive workforces have the highest drug-positive test rates in a decade. The positivity increases are driven primarily by cocaine, methamphetamine and marijuana.
The data also show the four common opioids that the U.S. DOT added last year in urine testing — hydrocodone, hydromorphone, oxymorphone, and oxycodone — have a higher positivity rate than the two opioids that were previously being tested — codeine and morphine.
The following data is a summary of a recent report compiled from 10 million U.S. drug tests conducted by Quest Diagnostics, a large medical lab. Many of Quest Diagnostics’ clients have safety-sensitive workforces that have federally required drug testing, including pilots, bus and truck drivers.
Cocaine
In the federally-mandated, safety-sensitive workforce, for which only urine testing is permitted, cocaine positivity increased by eleven percent (0.28 percent in 2016 versus 0.31 percent in 2017). This is the third consecutive year of increases in this workforce segment.
A new pattern emerged in this year’s analysis, with cocaine positivity in urine testing increasing significantly in certain states among the general U.S. workforce. Double-digit year-over-year increases in at least four of the five past years were seen in the states of Nebraska (91 percent), Idaho (88 percent), Washington (31 percent), Nevada (25 percent), Maryland (22 percent), and Wisconsin (13 percent).
Methamphetamine

The percentage increase in these four U.S. Census divisions ranged between nine percent and 25 percent between 2016 and 2017.
Quest Diagnostics has created this map that shows positivity by state and compared to the national average.


Marijuana
Overall, marijuana positivity continued its five-year upward trajectory in urine testing for both the general U.S. workforce and the federally-mandated, safety-sensitive workforce. Marijuana positivity increased four percent in the general U.S. workforce (2.5 percent in 2016 versus 2.6 percent in 2017) and nearly eight percent in the safety-sensitive workforce (0.78 percent versus 0.84 percent).
Increases in positivity rates for marijuana were most striking in states that have enacted recreational use statues since 2016. The increases in marijuana positivity for safety-sensitive workers increased by 39 percent in Nevada, 20 percent in California, and 11 percent in Massachusetts.
“These increases are similar to the increases we observed after recreational marijuana use statues were passed in Washington and Colorado,” said Barry Sample, PhD, senior director, science and technology, Quest Diagnostics.
Prescription opiates
Nationally, the prescription opiate positivity rate dropped by double digits on a national basis for the general U.S. workforce in urine drug testing. The rate declined 17 percent between 2016 and 2017 (0.47 percent versus 0.39 percent).
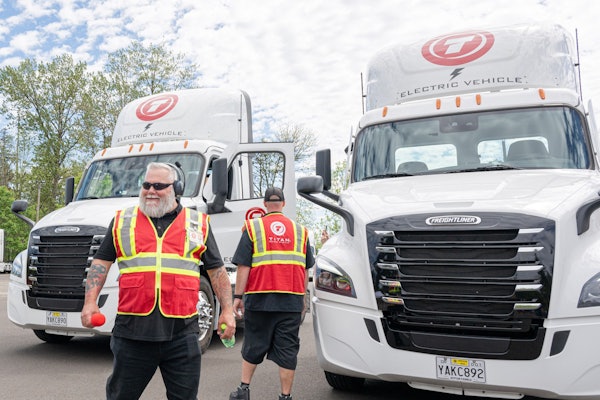
 The Trucking Alliance says hair sample tests will better screen for opioid use among truck driver applicants.
Prescription opiate testing for safety-sensitive transportation workers covered under U.S. Department of Transportation (DOT) rules went into effect in January 2018. Based on four months of data in 2018, Sample says the positivity rate for hydrocodone, hydromorphone, oxymorphone, and oxycodone are “certainly higher by large multiple” compared to the positivity rate for codeine and morphine.
The additional four prescription opiates being tested are not more impairing nor more addicting than morphine, he says. Quest Diagnostics and other laboratories refer positive test results to a medical review officer (MRO). The MRO will then determine if the driver has a valid prescription for the drugs and has the ability to issue a safety concern letter to the employer.
Combined testing
Many trucking companies are conducting hair follicle testing in addition to the DOT-mandated urine test. Based on Quest Diagnostics data, Sample says hair testing gives higher positivity rates.
Hair tests detect patterns of repetitive drug use, he says. It is the most effective test for detecting cocaine use, says Sample, who has a Ph.D. in pharmacology and is a board-certified toxicologist.
In other industries, oral fluid tests are also commonly used. Sample says the drug positivity rate for marijuana use is higher in oral fluid testing compared to hair or urine tests.
“There is value in having more than one testing specimen at your disposal,” he says. A primary advantage that hair and oral fluid testing have over urine tests is they are observed collections, which makes them impossible to subvert in private, Sample says.