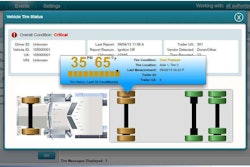
Highlighting the best and worst MPG-related performers, Vusion MPG Analytics Dashboard points to driver coaching/training opportunities. Peer average and peer range are also included for additional context. The dashboard’s Heat Map (above) emphasizes actionable issues that need addressing with red alerts.
Vusion, a division of PeopleNet, announced the launch of its MPG Analytics Dashboard at the 76th annual Truckload Carriers Association annual conference in Grapevine, Texas. The MPG Analytics Dashboard connects and interprets, and depicts data from multiple, relevant sources: the engine control module (over-speed, over-RPM, idle time, excess-speed), GPS (temperature, topography), dispatch (load weight), vehicle (vehicle age, engine size, make and model) and fuel purchases. The system is designed to provide quick access to data that would otherwise take hours or days to compile.
“Collecting and analyzing data that impacts fuel use is critical for identifying areas that can be improved, as well as making vehicle buying/trading decisions,” says Tom Fansler, Vusion president. “Our new dashboard visually displays information, making analytics practical and actionable by emphasizing issues that need addressing via red alerts on what we call a heat map.”
Vusion’s dashboard allows fleets to customize configurations for its heat map (red and yellow alerts), asset groups and timeframes (day ranges). In addition, the dashboard displays behaviors specific to each driver and peer referencing as a context for coaching.