Economic conditions continue to be mixed, but trucking indicators continue to be more positive than the recently reported contraction in overall U.S. economic activity. That just means, as usual, truck freight and rates can be hit and miss, depending on markets, customers and lanes. Here’s a round-up of the latest reports.
Cass Freight Index
North American freight shipments and expenditures continued to buck broader trends and increased again in May, according to the latest Cass Freight Index Report. Indeed, the first five months of 2014 were the strongest since the end of the great recession.
“While this seems counter to the dismal GDP reading for the first quarter, which shows a one percent drop or a contraction in the economy, much of the decrease in GDP can be attributed to declining inventories, slowing exports and weather related issues,” explains Rosalyn Wilson, a supply chain expert and senior business analyst with Delcan Corp. “Many other economic signs, especially growth in the manufacturing sector, point to an uptick in the five-year recovery and a continued increase in freight movements.”
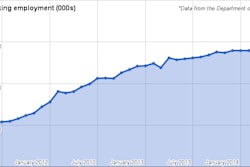
May shipment volumes rose 1 percent to the highest level since October 2011, the fourth month in a row that the number of shipments increased. May shipments were 3.6 percent higher than a year ago and 26.4 percent higher than shipment levels at the end of the 2009 recession.
“Capacity problems are being experienced in both the trucking and the rail industries as volumes grow,” Wilson says. “The impact of productivity – reducing truck regulations – has exacerbated the driver shortage, further limiting capacity despite the strong growth in the size of the truck fleet in 2014.”
Freight expenditures climbed up 1.1 percent in May, setting another record high. Spending was 11.2 percent higher than a year ago and 77.7 percent higher than at the recession’s end in 2009.
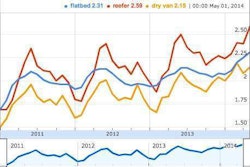
“While freight rates are not showing the full effect of tightening capacity – yet – it is unlikely that this situation will continue,” Wilson says. “New equipment and drivers have been added to the trucking fleet, and both are increasing costs substantially. However, freight expenditures are up 11 percent since the beginning of the year, which is lower than the 13.1 percent increase in the number of shipments. This indicates that rates are very competitive, Wilson notes.

The downward revision in first quarter GDP is not a harbinger of things to come, she concludes, citing bad weather and a substantial drop in business inventories, “which is a negative factor for GDP but an overall positive for the economy.”
“The health of the freight market is a very good indicator of the direction in which the economy is moving,” Wilson says. “All indications point to moderate growth in freight over the next couple of months, which will bode well for the economy in general.”
FTR Trucking conditions
FTR’s Trucking Conditions Index fell more than two points to a reading of 5.91. The current reading is below the recent trend line for this index but “simply reflects short-term fluctuations” in the overall measurement of trucking conditions.
The environment for carriers remains very positive, however, with rising prices and tight TL hauling capacity.
FTR expects truck utilization to remain above 98 percent indefinitely with good freight demand, limited capacity, and sustained regulatory drag affecting the sector. These conditions continue to push pricing higher with an expected growth of 5 percent or greater during 2014.
“Just as the truck environment continues to get back to normal, revisions to the GDP data for Q1 give everyone a moment of pause. How could we have had such a strong trucking market when the economy was apparently in decline?” says Jonathan Starks, FTR’s director of transportation analysis. “Part of the answer lies in the fact that goods movement was abnormal during this winter, and it likely led to a reduction in final inventories at many places. This was one of the biggest weak spots in Q1 GDP. So far, there is no indication that this has continued into Q2.”
Trucking looks to be on “very solid footing” and should continue to show growth throughout 2014, Starks says.
Manufacturing
Economic activity in the manufacturing sector expanded in May for the 12th consecutive month, and the overall economy grew for the 60th consecutive month, say the nation’s supply executives in the latest Manufacturing ISM Report On Business.
The May PMI registered 55.4 percent, an increase of 0.5 percentage point from April’s reading of 54.9 percent, indicating expansion in manufacturing for the 12th consecutive month.
The Supplier Deliveries Index registered 53.2 percent, 2.7 percentage points below the April reading of 55.9 percent.
Comments from the panel reflect generally steady growth, but note some areas of concern regarding raw materials pricing and supply tightness and shortages.
Of the 18 manufacturing industries, 17 report growth in May and no industry reported contraction.
Housing
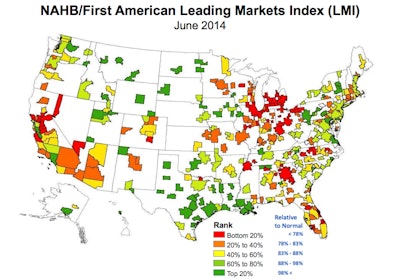
Of the approximately 350 metro markets nationwide, 56 returned to or exceeded their last normal levels of economic and housing activity, according to the National Association of Home Builders/First American Leading Markets Index (LMI). This represents a net gain of nine metros year over year.
The index’s nationwide score held steady at 88 percent of normal economic and housing activity from the previous month. Meanwhile, 30 percent of metro areas saw their score rise and 83 percent have shown an improvement over the past year.
“Markets are gradually returning to normal levels of housing and economic activity,” says NAHB Chairman Kevin Kelly, a home builder and developer from Wilmington, Del. “When we see more sustainable levels of job growth, this will unleash pent-up demand and bring more buyers into the marketplace.”
Baton Rouge, La., continues to top the list of major metros on the LMI, with a score of 1.4 – or 40 percent better than its last normal market level. Other major metros at the top of the list include Honolulu; Oklahoma City; Austin, Texas and Houston.
“Of the three components in the LMI, the one lagging is single-family housing permits, which is only 43 percent of the way back to normal while home prices are 26 percent above their last normal level and employment is at 95 percent of its previous norm,” says NAHB Chief Economist David Crowe. “In the 22 metros where permits are at or above normal, the overall index indicates that these markets have fully recovered.”