Revenue and income for some of the country’s largest carriers, as reported over the last few weeks in their public quarterly earnings reports issued to shareholders, dipped in the first half of 2017 compared to the same period last year.
Most of the carriers who file quarterly earnings statements, some of the country’s largest trucking companies, reported increased operating expenses, mostly stemming from fuel, maintenance and employee salaries and benefits. Expenditures on so-called purchased transportation, that is hiring on owner-operators or small carriers to move loads, also rose for most of the country’s publicly traded carriers.
2016 was a rocky year for the many carriers, due to cheap freight rates and, at times, sluggish freight movement. Several of the same carriers listed below reported declines in revenue and profits in 2016 compared to the year prior. Those conditions, at least according to the reports filed this month and last, appear to be lingering.
The numbers below are for January-June of both years.
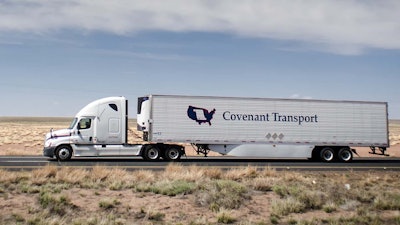
Covenant Transportation
Gross revenue
2017: $323 million
2016: $315.1 million
EBIDTA
2017: $44 million
2016: $47.6 million
Net Income
2017: $1.5 million
2016: $7.4 million
Diluted earnings per share:
2017: 8 cents/share
2016: 20 cents/share
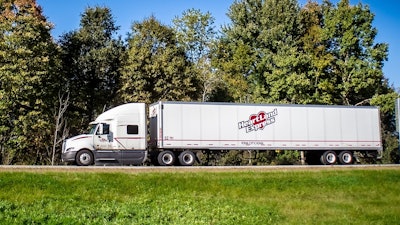
Heartland Express
Gross revenue
2017: $259.5 million
2016: $323.6 million
Net Income
2017: $40.7 million
2016: $44.8 million
Diluted earnings per share:
2017: 34 cents/share
2016: 37 cents/share
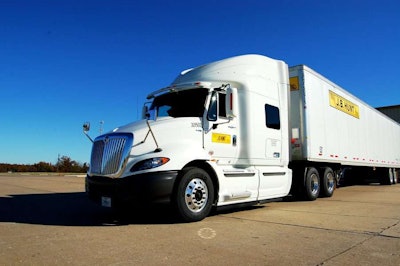
J.B. Hunt
Gross revenue
2017: $3.012 billion
2016: $291 billion
Net Income
2017: $313 million
2016: $343.7 million
Diluted earnings per share:
2017: $1.80/share
2016: $1.80/share
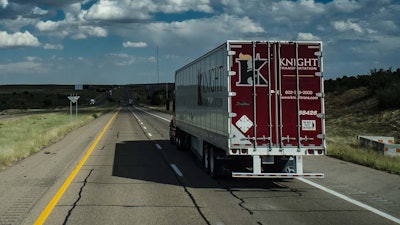
Knight Transportation
Gross revenue
2017: $544.4 million
2016: $548.4 million
Net Income
2017: $32.8 million
2016: $47.9 million
Diluted earnings per share:
2017: 40 cents/share
2016: 59 cents/share
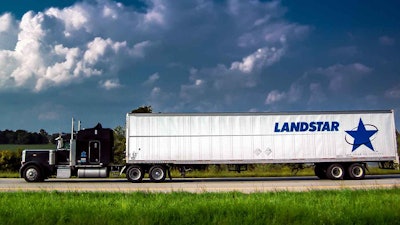
Landstar Systems
Gross revenue
2017: $1.651 billion
2016: $1.487 billion
Net Income
2017: $69.9 million
2016: $61.5 million
Diluted earnings per share:
2017: $1.66/share
2016: $1.45 /share
Marten Transportation
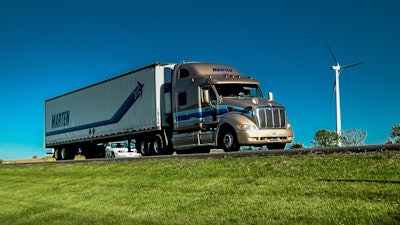
Gross revenue
2017: $344.7 million
2016: $328 million
Net Income
2017: $17.4 million
2016: $16.7 million
Diluted earnings per share:
2017: 23 cents/share
2016: 56 cents/share
P.A.M Transportation
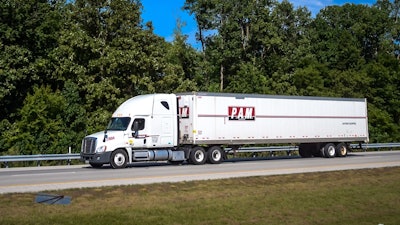
Gross revenue
2017: $218 million
2016: $215.1 billion
Net Income
2017: $3.89 million
2016: $6.92 million
Diluted earnings per share:
2017: 61 cents/share
2016: $1.01 /share
Swift Transportation
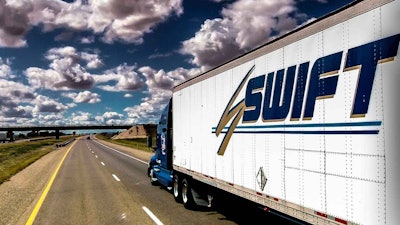
Gross revenue
2017: $1.956 billion
2016: $1.978 billion
EBIDTA
2017: $216 million
2016: $269 million
Net Income
2017: $31.5 million
2016: $74.8 million
Diluted earnings per share:
2017: 23 cents/share
2016: 56 cents/share
USA Truck
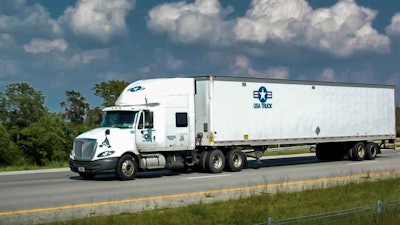
Gross revenue
2017: $209 million
2016: $$220.5 million
Net Income (loss)
2017: ($7.7 million)
2016: ($3.2) million
Diluted earnings (loss) per share:
2017 (2Q): (96 cents)/share
2016 (2Q): (35 cents)/share
Werner
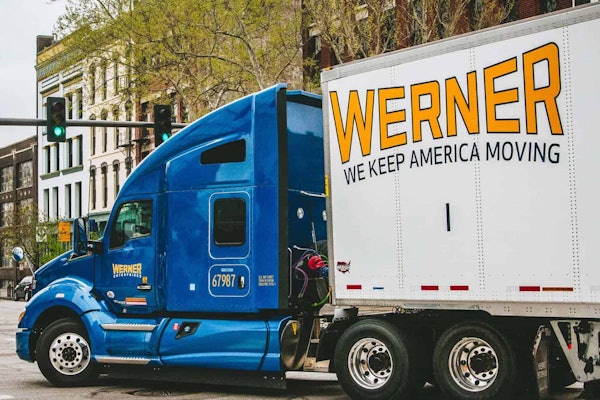
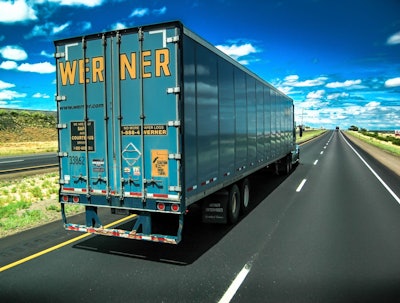 Werner in its third quarter earnings report said it cut 90 more trucks from service in the quarter, bringing its year-over-year reductions to 240. “We again reduced our average trucks in service…from second quarter 2016 to third quarter 2016 in response to the freight market conditions. We are not growing our truck fleet until we see meaningful improvement in the freight and rate markets,” Werner’s earnings report reads.
Gross revenue
2017: $1.021 billion
2016: $981.4 mllion
Net Income
2017: $39.2 million
2016: $38.4 million
Diluted earnings per share:
2017: 54 cents/share
2016: 53 cents/share


