The economy is like the weather: If you don’t like it, stick around – it will change. Here’s a roundup of several recent partly-cloudy reports covering carrier capacity plans and freight volume.
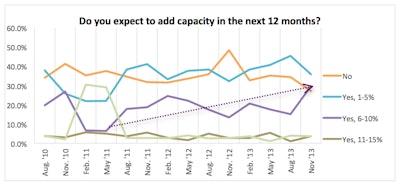
Carrier survey: The fourth-quarter Transport Capital Partners survey finds a large majority of carriers expecting to grow capacity, and many are moving to replace their aging vehicles.
New hours-of-service rules mean lower utilization of equipment. As a result, carriers are being pushed to increase capacity and raise driver pay. The number of carriers indicating they are not going to add capacity has been trending down, and is now at its lowest level yet for the survey, at 27 percent.
 (Transport Capital Partners)
For the first time, 30 percent of carriers expect to grow capacity by 6 to10 percent. These results are “not surprising” given that 78 percent of the carriers this quarter indicated they had lost productivity due to HOS changes, according to the analysis.
Larger carriers expect to be more aggressive in adding equipment than smaller carriers. Thirty-nine percent of larger carriers expect to add 5 to 15 percent, compared with only 27 percent of smaller carriers.
Among those intending to add capacity, the percentage of carriers planning to add capacity through the use of independent contractors has jumped from 16 to 26 percent.
The most commonly reported method for adding capacity is through company equipment that is either financed or purchased on a TRAC Lease: 35 percent, up from 26 percent last quarter. Carriers adding capacity by purchasing other carriers has increased from 0 percent three quarters ago to 6 percent.
Similarly, as carriers increase capacity, they are also more likely to replace their older vehicles. Almost 40 percent expect to replace 11 to 25 percent of their fleet this year.
Again, the difference between smaller and larger carriers is “striking,” the report notes: Seventy-seven percent of smaller carriers plan to replace less than 10 percent of their fleet compared with 40 percent of larger carriers. Conversely, almost three times as many larger carriers expect to add 11-25 percent (50 percent vs. 15 percent).
“We suspect that all the 2007 pre-buy tractors are being traded out. If smaller carriers are not able to replace older, less fuel-efficient equipment (and their higher maintenance costs), those carriers will not be well positioned to benefit from looming good times,” says TCP Partner Richard Mikes.
More details and graphs are here.
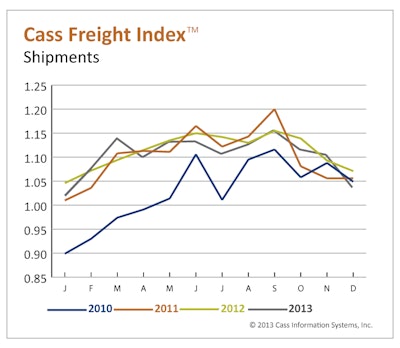
Cass index: Freight shipments and expenditures fell sharply though seasonally in the last month of 2013, according to the latest Cass Freight Index Report.
North American freight activity followed virtually the same path as it did in the previous two years, concluding with “the typical December fall-off,” notes Delcan Corp.’s Rosalyn Wilson, who provides supply chain analysis for Cass.
“The climate for freight was mediocre throughout 2013, with the average number of monthly freight shipments 0.7 lower than in 2012. Inventories remained high, manufacturing stalled mid-year, and exports and imports were relatively flat for most of the year,” Wilson said. “All of this contributed to another bumpy year in the recovery that hasn’t quite gotten there.”
Freight volumes in North America plummeted 6.2 percent from November to December, making this the largest monthly drop in 2013 and the third straight monthly decline. December shipment levels were 3.2 percent lower, according to the index.
“Despite the fact that there were fewer shipments in 2013, other indicators, such as the American Trucking Associations’ Truck Tonnage Index, have shown that loads have been getting heavier,” Wilson adds. “This matches well with anecdotal evidence from LTL carriers that they are carrying fuller loads.”
Freight expenditures dropped 5.4 percent from November. Total freight expenditures generally moved up and down with freight volumes throughout the year. From a year ago, expenditures were up 1 percent against 3.2 percent fewer shipments.
“Given that rates for most modes remained largely unchanged in 2013, these numbers support other data that the average shipment was larger and therefore more expensive,” Wilson says.
The index does not capture small parcel sector data, the report notes.
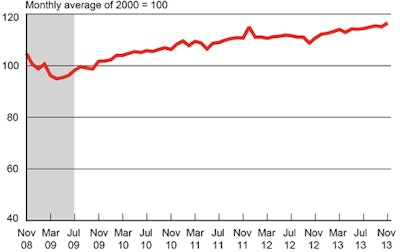
DOT measure: In the latest government report, however, the amount of freight carried by the for-hire transportation industry has reached its highest all-time level.
The Freight Transportation Services Index rose 1.2 percent in November from October, rebounding from a one-month decline, according to the Department of Transportation’s Bureau of Transportation Statistics. The November 2013 index level (116.5) exceeded the previous high of 115.4 in September 2013, and was 22.8 percent above the April 2009 low, set during the most recent recession.
 (Bureau of Transportation Statistics)
The Freight TSI measures the month-to-month changes in freight shipments by mode of transportation in tons and ton-miles, which are combined into one index. The index consists of data from for-hire trucking, rail, inland waterways, pipelines and air freight.
The November rise was a result of increases in all modes except pipeline, according to the BTS analysis. Growth in tonnage intensive industries such as heavy construction and oil and gas fracking produced an increase in truck tonnage. Both trucking and rail benefitted from growing auto production.
For 2013, freight shipments measured by the index were up 3.8 percent through the first 11 months, compared to the end of 2012, the report said.
This week’s reports: Tuesday, Jan. 14: Retail sales, business inventories. Wednesday: Producer Price Index, Beige Book. Thursday: Consumer Price Index, jobless claims; Friday: Housing starts, industrial production, consumer sentiment.


