Lane by lane

By Aaron Huff
Tammy Thornburg is an expert analyst, but finding the profit margin of every trucking lane is no cakewalk. The routes of her employer, B.R. Williams, change constantly.
To make the process more efficient, Thornburg – senior accounting manager for the Oxford, Ala.-based truckload carrier – created a program with Microsoft Access that uses data from the company’s dispatch, accounting and other databases.
“She can do things you can’t even imagine,” says Greg Brown, chief executive of the 170-truck fleet.
But the Access program soon became a bottleneck. When managers needed information to make pricing and other decisions, they had to come through Thornburg to get it. “Nobody else knows Access,” Brown says. “It is cumbersome.”
So in June 2011, Thornburg converted the program to a networked Excel database. Managers now use pivot tables to sort profitability data by customer, lane, date range and other dimensions.
“It makes us so much more responsive to lane analysis by providing it in a format that managers can use without our assistance,” Brown says.
The pivot table is designed to show lane profitability on a roundtrip basis. Trips are identified by customer and destination city of outbound loads. Each trip includes costs and revenues of the outbound load and all backhauls.
Managers focus on the net revenue per mile per trip – the difference in gross revenues and expenses divided by miles. The current goal is to average 72 cents of net revenue per mile for all trips. Since June 2011, B.R. Williams has seen gross revenue per mile increase by 5 cents and net revenue by 7 cents. This upward trend only should continue.
“We expect another 4- to 5-cent increase of gross revenue per mile before yearend, along with 5 to 6 cents of net revenue per mile,” Brown says.
“Part of the investment in technology was to help us become more efficient and look at data we were not looking at before.”
– Jodi Farley, director of operations and safety, MinStar Transport
Now that rates have pivoted in favor of carriers, quickly identifying and executing opportunities to increase profit margins is critical. Whether a fleet uses homegrown or commercial software to perform lane and profitability analysis, the following features can help expand margins.
The lens of time
Fleet managers traditionally have analyzed costs and revenues on a cents-per-mile basis, but with changes to hours-of-service regulations, traffic congestion and other factors, time is now an equally – if not more – critical part of the cost equation.
Every load has a finite period of time to increase profitability; once the opportunity passes, it is gone forever. “People finally understand that velocity is a huge factor,” says Randy Seals, customer advocate for McLeod Software. “Everything you do that adds time decreases your profit.”
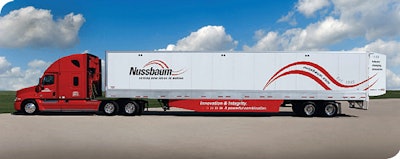 Nussbaum Transportation, a Normal, Ill.-based 200-truck carrier, created a software system, Freight Mixer, which extracts data from the company’s enterprise system.
Profitability Analysis, an optional module for McLeod’s LoadMaster enterprise transportation system, gives visibility into cost, revenue and profitability factors. The velocity feature for each load in the system, measured in miles per hour, begins at the time and location a trailer is loaded and ends when the trailer is empty.
Velocity can be used to gauge load profitability quickly, Seals says. A fleet manager may know that loads in a certain 500-mile lane must move at 25 mph to meet the company’s daily revenue and profit goals.
MinStar Transport regularly analyzes profit to help improve its 100-truck fleet. About 1½ years ago during a growth phase, the Eagan, Minn.-based company implemented LoadMaster with Profitability Analysis. The carrier primarily hauls ATVs for distributors to nationwide dealerships.
“Part of the investment in technology was to help us become more efficient and look at data we were not looking at before,” says Jodi Farley, director of operations and safety.
Farley recently used the module to analyze the profitability of two different trailer types. The company has standard vans and specialty vans with double-deck flooring. The double-deck trailers enable MinStar to haul more ATVs per load, but management questioned if using these trailers was less profitable. Drivers have to load and unload more rolling stock and often make more delivery stops than they do with standard vans.
The analysis showed that MinStar could decrease its customers’ costs by hauling more ATVs in the double-deck trailers without adding more time to make pickups and deliveries.
But the random nature of fleet operations often makes it difficult to use time as a standard for load profitability. While fleets with irregular routes such as truckload carriers might have a fairly predictable set of outbound lanes from one location, their backhaul routes branch off in multiple directions.
“It is difficult to know how they are all tying together,” says Bill Wettstein, chief financial officer of Nussbaum Transportation, a Normal, Ill.-based 200-truck carrier. “(Profit) is largely affected by other lanes. We really had a hard time putting a finger on it and keeping track of various facets.”
Lane analysis used to be time-consuming and imprecise for Nussbaum Transportation. For each outbound lane, Wettstein would select a few loads to represent the backhauls. He then had to allocate costs such as time, equipment, driver pay, tolls and fuel to each segment of the trip manually.
To solve this challenge, the IT department at Nussbaum Transportation created a software system, Freight Mixer, which extracts data from the company’s enterprise system and has supplemental fields to specify additional cost factors such as the number of trailers assigned to a specific customer location.
One of the most beneficial features of Freight Mixer is being able to track the time involved in a load and the amount of revenue generated daily by its assets. Before using Freight Mixer, “we weren’t paying as much attention to the efficient use of driver time,” Wettstein says.
The system also enables Nussbaum Transportation to target specific lanes for pricing adjustments. “It has allowed us to evaluate criteria on individual lanes instead of saying we need an increase on the entire book of business,” says Brent Nussbaum, president and chief executive. “We started focusing on individual lanes and improving yield every month.”
Bid analysis
Responding to bid requests and managing a sales force can be hands-on and time-consuming. The carousel of cost analysis, market research and strategic planning and other details of this process can be automated with technology.
One way fleets have automated the pricing and sales process is to create a live matrix of the costs and rates in their freight network. This matrix contains all headhaul markets, the best lanes from these markets and the expected rates to be earned in each lane.
 B.R. Williams, an Oxford, Ala.-based 170-truck truckload company, uses pivot tables to sort profitability data by
customer, lane, date range and other dimensions.
McLeod’s LoadMaster system comes standard with a pricing matrix and other features in the Lane Analysis module. Users quickly can identify where to focus their sales efforts and set other priorities, Seals says.
MinStar recently used Lane Analysis to focus on improving the profitability of markets such as Virginia, where deadhead miles have been going up. The tool “makes things stand out,” Farley says. “There are so many different things you can pull out. You can find anything you want broken down by lane.”
Few fleets operate in a true “out-and-back” environment where every load can be counted as a headhaul or a backhaul. Some carriers use technology that provides a way to isolate and evaluate the profitability of each load within their freight network.
TMW Systems offers an advanced analysis tool, IDSC Netwise, which carriers can use to evaluate and manage their freight mix, lanes and customer profitability. Netwise measures profitability through yield, which evaluates each load on a scale of 100 and includes the cost, rate, time and flow of a load within the carrier’s freight network.
IDSC Netwise also can be used to evaluate freight bids quickly. Fleets can import and merge information from a bid package with their current freight network. IDSC Netwise will identify the lanes and volume on which a carrier should bid. The process, which takes 30 minutes to an hour, shows “what you want and how you want to respond to bids,” says Frank Mabry, director of professional services for TMW Systems.
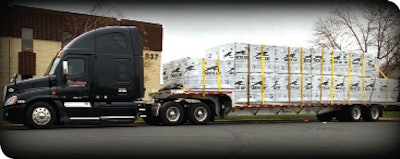 MinStar Transport, an Eagan, Minn.-based 100-truck fleet, implemented LoadMaster with Profitability Analysis about 1½ years ago during a growth phase.
Fleet managers also can use IDSC Netwise on a daily basis to quote spot rates. On a more periodic basis, such as monthly or quarterly, they can use it to identify freight patterns and see where their network is unbalanced with capacity or loads. The software also can be used to perform “what-if” analysis, such as to see the impact of losing a customer, adding a customer or merging two companies’ freight networks for an acquisition.
TMW Systems also offers a “light” version of IDSC Netwise called Freight Analyst. This Web-based system extracts data from clients’ enterprise systems monthly for cost and freight flow analysis.
Including current market rates in the analysis also can help identify lanes to maximize profits. PCS Software’s Express transportation management system includes a feature that extracts general rate information from more than 1,000 carriers and brokerage customers.
This rate information from users is available as a built-in rate index. A user can see how the average rates by lane, trailer and commodity type compare to any load currently in the system or for a lane they wish to quote. By hitting a “rate report” button, they can see average lane-specific rates over a 12-month period.
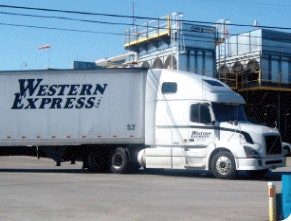 Nashville, TENN.-based Western Express, a 2,000-truck van and flatbed fleet, implemented Manhattan Associates’ Driver & Load for power-to-load recommendations.
TransCore offers a daily snapshot of supply and demand across the country in its Hot Market Map. Most customers use it as a starting point for their daily planning, says Ken Harper, marketing director of DAT products and services.
“It’s one of those visual planning tools that lets them see at a glance where loads are,” Harper says. “Depending on the features they have, they can click to find out what the broker buy rate is on their lanes.”
A separate product, the DAT Truckload Rate Index, can be used to review a 14-day, 30-day and/or 13-month history of a lane’s rates by equipment type.
Real-time execution
Without execution, even the most advanced tools for profit analysis and strategic planning are rendered useless. One way to ensure daily execution of profitability is with real-time alerts and controls.
The PCS Express system can help prevent dispatchers from making assignments of trucks to loads that fall below a preset minimum profit level. If a dispatcher tries to assign a truck to a load that results in less than his company’s preset profit margin, the status of the load assignment automatically will change to “pending.” A supervisor receives a real-time alert with all the information about the load and has to approve the load to change the status to “active.”
Fleets that dispatch several hundred or more trucks each day might consider using automated power-to-load optimization software designed to maximize profit primarily by reducing empty or deadhead miles given the current status and availability of equipment, drivers and loads.
IDSC Match Advice from TMW Systems continuously updates its recommendations for power-to-load assignments. Unlike Netwise, the tool is not designed to recommend markets or customers that a fleet should target for sales; rather, it mathematically gives the best current option.
Until last year, all power-to-load matching at Nashville, Tenn.-based Western Express was a manual process. Regional managers and customer service representatives for the 2,000-truck van and flatbed fleet used the Innovative Enterprise Software platform to assign loads on the top half of the screen to trucks on the bottom half.
They also were using two Websites to get drivers’ hours-of-service details and road mapping and mileage information to solve the daily puzzle.
This manual process changed when Western Express implemented Driver & Load from Manhattan Associates. The optimization software gives recommendations for power-to-load combinations that appear within the IES screen along with supporting details.
Customer service representatives and planners are saving about two hours a day by “not sitting there thinking about what they should be doing,” says Jay Erksine, director of customer service. “It allows more time to talk to customers.”
While the window of opportunity for fleets to increase profit margins may not be long-lived, using technology to gain an edge quickly by identifying both profitable and unprofitable business might be an economic life preserver.


