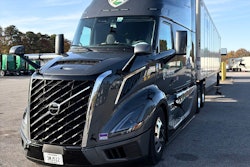
Cowan Systems, a Baltimore-based truckload carrier that operates 1,400 tractors throughout the East Coast and mid-Atlantic regions, measures productivity primarily by revenue per truck per day, says Dennis Morgan, chief operating officer of the Baltimore-based company.
Increasing the utilization of your equipment and drivers is a critical challenge in any market – and especially today when costs are high and freight is soft. This task would be fairly simple if every load or shipment were just like the other. But rates, weights and handling requirements vary. Each customer, driver and route has its own individual behavior and attributes. So what exactly can you do to increase efficiency and profitability?
Fleet managers can see the big picture through the lens of metrics such as revenue per truck per day, pounds per man hour, stops per hour and various other financial ratios. A major problem with the “big picture,” however, is that it often is seen through the past, as many measures are based on historical data and averages that do not uncover potential opportunities to improve. But through the latest advancements in technology, fleets can monitor nearly every activity in their operations instantly – and with more intelligence to filter out the inefficiencies.
Setting desirable goals
One of the first steps to improving the productivity or profitability of any business activity is determining what performance level you need and should expect to achieve.
Instead of relying on historical data to find the fleet average for the time or mileage to complete a certain route, shipment or a stop, fleets should use “engineered standards,” says Robert Sullivan, a fleet management consultant and president of Effective Management Systems.
“Using historical standards does one thing very well – it represents what has already happened in the past,” Sullivan says. “Those standards, based on historical data, are permeated with your inefficiencies, and actually perpetuate them.”
Engineered standards are unique to each activity and are based on method, shipment characteristics and miles, Sullivan says. They calculate the time a specific activity should require for the average worker.
Sullivan typically helps fleets, particularly less-than-truckload carriers, develop engineered standards in person through careful evaluation. Once the standards are set, carriers use the AS400-based EMS Software Solution to automate the costing, efficiency, profitability and performance metrics.
Lakeville Motor Express uses the EMS system to compare actual performance to engineered standards for all of its stops, bills, pieces, weights and miles for pickup-and-delivery trips. The Roseville, Minn.-based LTL carrier uses two separate indices or “scorecards” in the EMS system to compare actual activities to its performance standards: One index measures how well management utilized each resource – the truck and driver; the other index measures how well the resource performed the work assigned to it.
If a driver executes all his deliveries and pickups on a 150-mile route in the standard time and mileage, the EMS scoring system shows whether or not the driver was given a proper workload. “The beauty (of EMS) is that it brings the two (indices) together,” says Richard Schwartz, operations analyst for Lakeville Motor Express. “It works with drivers and managers to maximize efficiency.”
Drilling down to details
By contrast, truckload carriers typically do not measure individual activities with as much precision as LTL carriers because truckload drivers handle fewer stops and usually don’t physically handle freight.
Cowan Systems, a truckload carrier that operates 1,400 tractors throughout the East Coast and mid-Atlantic regions, measures productivity primarily by revenue per truck per day, says Dennis Morgan, chief operating officer of the Baltimore-based company. The measure consists of linehaul revenue, excluding fuel surcharges, divided by the total tractors in the fleet.
By tracking revenue per truck per day against a standard, Cowan’s fleet managers know the minimum revenues their daily activities must produce to cover the company’s operating costs. They also know, indirectly, what level of productivity to expect from each driver and tractor under their control.
At any time during the day, Morgan quickly can drill down to find specific areas of concern – such as revenue by area, fleet manager or driver – by using Results Now, a real-time performance reporting and monitoring tool from enterprise resource software provider TMW Systems.
“You can look at all kinds of things – whatever you want to dream up,” Morgan says. Currently, the fleet’s empty miles are the No. 1 issue impacting profitability. With the cost of diesel at $4 per gallon, carriers can no longer tolerate empty miles just because there’s a fuel surcharge on revenue miles, he says.
Cowan uses Results Now and other TMW reporting tools to drill down the fleet’s empty mileage by lane, driver, fleet manager and division; lanes with the most prevalent empty miles are passed to the sales staff to fill voids. “Even in the older days, you could never recover all of your added costs of fuel when fuel went over $1.25 a gallon based on $1.50-per-mile rates,” Morgan says.
Memphis, Tenn.-based Ozark Motor Lines developed a tool for its AS400-based Innovative Enterprise System to increase the visibility of performance information to its managers. In 2007, Innovative Computing Corp. offered the tool to its customers as IES Snap. Ozark uses IES Snap to display the status of critical productivity and profitability metrics, with the ability to drill down to more detailed views of data.
One screen shows a summary of all power units in Ozark’s fleet of 800 trucks, such as the number available, in the shop, on dispatch, at home, etc. The same screen gives operations managers visibility of all trucks that are available at any point during the day. Prior to using IES Snap, Ozark’s customer service representatives often would hide available trucks from others in the company to offer to their own customers.
“That’s not good for Ozark,” says Dean Plessala, the carrier’s senior programmer and analyst. “We need to see everything available.” Ozark also uses IES Snap to display a summary screen from its power-to-load optimization software. Operations managers now can see, at a glance, what the savings would have been had any customer service representative followed the software’s optimal advice for matching trucks with loads, Plessala says.
Picking and choosing
Each day, your managers must make important decisions regarding which customer, lane and type of freight to assign to your equipment. With margins stretched thin, even the slightest mistake subtracts from the bottom line.
Blenker, Wis.-based truckload carrier deBoer Transportation uses a truckload profitability reporting system from Transportation Costing Group called TL/CIS. The carrier holds monthly management meetings to review the profitability of all lanes, drivers, fleet managers and customer service managers, says Roger Plazcek, vice president of marketing.
By using the software, deBoer’s marketing department quickly can determine the root cause of why any segment or activity in its business is unprofitable. Plazcek says the root cause usually boils down to one of the following: company assets aren’t productive enough, the rate isn’t compensatory, or the lane no longer fits into its operational design.
On a daily basis, deBoer’s customer service representatives use the TCG program to see where the best load opportunities are in their region by using operating ratios of each customer and lane to prioritize how they will allocate capacity. Fleet managers use the system to get a daily snapshot of driver profitability based on revenue as well as costs under their control, such as fuel economy.
“We measure drivers based on the assumption that they are able to perform the load they have in a legal, safe and the most cost-efficient manner,” Plazcek says. “Our internal optimizing system provides the right load for drivers in the fleet manager’s region.”
The ability to view profitability across its operations has led deBoer to make significant changes, such as the decision to stop serving the Northeast, and it has transformed deBoer’s culture from one based on maximizing revenue to one based on maximizing profits. “Margins are so thin that everything we do is driven by profits,” Plazcek says.
With the latest features from enterprise-wide fleet management systems, carriers can monitor a wide range of complex activities and behaviors. Management can receive instant alerts when any activity falls outside certain parameters. Last fall, McLeod Software released its Rapid Alert Notification System (RANS) that sends real-time notifications to supervisors.
“It’s like a ‘spell check’ for dispatchers,” says Rick Halbrooks, vice president of marketing and sales for McLeod Software. If a dispatcher is about to book a load that is not profitable or below a threshold for revenue per day, RANS sends the operations manager an instant message that the dispatcher is planning an unprofitable load. Using built-in instant messaging, the supervisor can intervene with the dispatcher before the load is assigned in the system.
“The software prevents people from doing things that aren’t part of the plan,” Halbrooks says.
While advanced software tools enable fleets to monitor nearly everything in real time, they also can generate an overwhelming amount of spam, says Dave Mook, chief operations and chief technology officer for TMW Systems. Fleets now are using features offered by TMW to automate the workflow to correct some exceptions before generating an automatic e-mail, such as a message to the shipper or driver that a load will be late. Advanced carriers also are moving toward data-driven analytics to see the future impact of their decisions, Mook says.
Through integration with optimization software from IDSC, a company that TMW acquired last September, TMW is developing a new set of alerts geared toward compliance in areas such as network balance, profitability and fuel optimization. The company is releasing a tool called Rate Checker that tells managers if they are over- or under-pricing any lane by comparing it to the market rate. An overpriced lane can be used as a leading indicator that a carrier might lose the freight in the future, Mook says.
Getting there efficiently
Mobile computing and wireless communications systems continue to add new advanced and intelligent features for fleets to examine both historical and real-time information to determine how to operate more efficiently. After all, determining which customer to serve is only part of the equation; figuring out the best route and delivery sequence is critical as well, for both truckload and LTL carriers.
Lakeville Motor Express relies on real-time information from Cheetah Software to assign and route vehicles to new shipments that arrive during the day and to forecast any problems such as late stops or deliveries. The Web-based Cheetah solution includes an application that resides on mobile phones carried by Lakeville’s drivers.
Lakeville dispatchers simply hit the “Best” button in the application that directs them to the best route driver to pick up the shipment based on its service and cost parameters. “It looks at the big picture,” Schwartz says.
When drivers pick up a shipment, they input shipment information into the Cheetah application on the handheld device. The information is used in the office to generate a “skeleton bill” for dock operations to plan in advance how they will transfer incoming freight to outbound trailers when drivers return.
“With today’s fuel costs, this helps manage our variable costs as close as possible,” says Schwartz, who points out that Lakeville has seen its miles per stop reduced as a direct result of using Cheetah Software.
Providers of onboard computing and mobile communications have many applications that fleets can use to develop more efficient plans and performance standards for specific activities.
PeopleNet has a tool called Activity Standards that its customers use to build time and mileage standards for each segment or “leg” of a trip. The tool is part of its Web-based user interface, the PeopleNet Fleet Manager (PFM). Fleets also report in the PFM or integrate directly with their dispatch system to assign drivers to loads based on proximity or available hours of service, says Glenn Williams, director of marketing.
Many fleets closely monitor the activities and performance of each route by using integrated routing and onboard computing software solutions. Fleets that use Xatanet by Xata Corp. can download their route plans – which include the stops in sequence and activities at each stop – to the onboard Xatanet unit, says Tom Flies, senior vice president of product strategy. When the driver logs in to Xatanet, the system downloads his current electronic logs and the route plan.
From the minute the trip starts, Xatanet notifies personnel in the office of any deviations from standard in the driver’s route performance, Flies says. Fleets can set up exception notifications, called Smart Checks, for up to 20 different factors.
And by setting up a geofence around each location on a route – a tight, virtual perimeter of coordinates that surround a location, such as a shipper – carriers can automate and synchronize all arrival and departure activities to the dispatch or routing plan, says Norm Ellis, vice president and general manager of transportation and logistics for Qualcomm Enterprise Services. Geofences make it possible to have irrefutable evidence of a delay in loading or unloading caused by the shipper, Ellis says.
Today’s color touchscreen displays available for onboard computing platforms can improve routing efficiency for drivers. Today’s fleets already are using advanced navigation systems from Maptuit and ALK on the DriverTech DT4000 platform, says David Lemperle, vice president of operations for DriverTech. Fleets can inject their actual dispatch routes and fuel stops directly into the navigation systems through the DriverTech communications platform, Lemperle says; as things change, the software onboard the vehicle will recalculate the route automatically.
With technology to determine quickly where inefficient and unprofitable activities are taking place – and to monitor for them continually in real time – it is possible to leave virtually nothing uncovered.
In tune with drivers
Automation of payroll, performance tracking yields efficiencies
For Mattingly Foods – a distributor of dry, refrigerated and frozen goods to major restaurant chains in the Midwest – one of the productivity indicators is “cases per hour,” says Brandon Hess, executive vice president of the Zanesville, Ohio-based company. But management doesn’t want drivers to focus on the metric; its customers typically do not focus on how fast a driver unloads their freight.
Mattingly pays drivers by the hour, but it does adjust its drivers’ hours if certain activities exceed time standards, such as for pre- and post-trip inspections, scheduled breaks or unplanned stops. Several years ago, adjusting driver hours required someone to search through paper logbook records manually and download trip information from onboard recorders. For each pay period, the payroll process took several days to complete.
Today, the payroll process is automated. In 2003, Mattingly Foods worked with Qualcomm to develop an automated payroll system that soon will be moved over to the new OmniVision platform.
Currently, driver logbooks and trip data are collected by Qualcomm’s Fleet Advisor onboard computing platform and matched against the business rules in Mattingly’s payroll system; any exceptions are highlighted automatically. The Qualcomm-driven payroll system also automates Mattingly’s driver incentive program; drivers receive a bonus for meeting fleet thresholds for idle time, speeding and RPMs.
“All data is collected, easily reported, measured and managed,” Hess says. “It has made a driver more productive by being managed better than before.”
The materials handling division of Tomra – a Sheldon, Conn.-based global materials recovery and recycling company – operates a nationwide fleet of 150 vehicles that picks up bottle containers from retailers and redemption centers. To carefully measure driver performance and drive continuous improvements in fleet efficiency, the division uses a route optimization and asset-tracking technology from Descartes Systems.
About three years ago, a Michigan-based Tomra fleet began using the Descartes tools on a seasonal and daily basis to create more efficient routes. Using the wireless application from Descartes that runs on mobile phones, managers can view real-time statistics on planned versus actual route performance. Over time, the company has developed engineered standards for the time each stop should take.
“I hate dealing with averages,” says Lou Grech-Cumbo, president of UBCR LLC, the Michigan-based Tomra unit. “We took averages out and do it on an individual basis.” Productivity has improved as managers coached drivers on how to improve their performance to meet fleet standards for each location.
Since using Descartes, Tomra has seen between 4 and 6 percent improvement in productivity and has reduced route mileage by 10 to 20 percent. “I think we can always improve, to continue to drill down and perform better,” Grech-Cumbo says. “The routing software is powerful. It takes four to six years of daily use to develop to the point where you can utilize it to the maximum.”


