The auto transport industry moved millions of vehicles in 2024, yet business leaders are still working to understand where the industry stands – and where it could be headed. Enter the Super Moves: State of Auto Transport Industry Report, based on data from nearly 15,000 carriers and 50,000. The report reveals the vehicle movement trends, pricing shifts, seasonal demands and disruptions influencing today’s auto transport market.
Fuel costs matter, not the whole story in load pricing
While diesel prices do affect transportation costs, their influence on load pricing is only moderate. Per-mile rates often rise with fuel costs, but factors like carrier availability, shifting demand, and specific route conditions have a major impact too.
Carriers also manage pricing based on how they build routes. “Anchor loads”—typically the first loads placed on a truck—are crucial to securing profitable lanes. Loads added later simply optimize space and efficiency. This strategic difference affects how carriers prioritize and price each shipment.
Bottom line: fuel is just one part of the equation. Prices fluctuate and will have a direct impact on profit margins, planning accuracy, and carrier profitability. Carriers, brokers and shippers need to stay on top of these changing rates to keep their budgets on track, so a growing number will turn to technology like real-time rate tracking, dynamic pricing tools, and predictive analytics to collect, analyze, and help respond quickly to market changes with smarter, data-driven decisions.
Shorter routes saw high rates
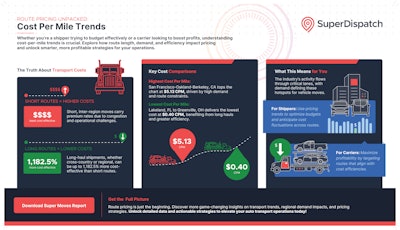
Per-mile costs varied significantly across Super Dispatch booked routes. The difference between the platform’s highest and lowest per-mile costs for common lanes was nearly five dollars per mile.
The Super Moves report shows that premium rates were charged on shorter, inter-region moves while long-haul shipments reflected the most cost-effective rates. Vehicle moves from the neighboring San Francisco to Oakland markets saw the highest $5.13 cost per mile (CPM) rate, a reflection of regional congestion, demand, and constraints. At just $0.40 per mile, Lakeland, Florida to Greenville, Ohio was the most economical route as were long hauls from Greeley, Colorado to New York ($0.41) and Washington, D.C. to San Francisco ($0.42).
This trend shows how location, distance, and local markets influence pricing, pointing to the need for more strategic route planning and pricing models. As carriers and brokers move forward, they’ll likely continue to prioritize balancing high-revenue short hauls with cost-efficient long-distance moves to optimize margins. Auto transport leaders should also consider incorporating route-specific analytics and load-matching tools to stay competitive.

High-volume concentrated to major U.S. Metros
Metro areas within the 10 most populous cities in the U.S. capped Super Dispatch’s lists for top vehicle origin and destination lists –– offering carriers and brokers insights into regional shipping patterns, demand hotspots, and long-haul transport trends across the U.S.
As for the breakdown, the top five metro origins included New York, Chicago, Los Angeles, and Atlanta, while Dallas, Chicago, Los Angeles, and Houston were top metro destinations.
Among the nation’s highest-traffic corridors, the New York-to-Miami transport route had the highest order volume. The route also generated the highest revenue at $8 million. The reverse of that route amassed the second highest volume and revenues of $6.5 million. Transportation routes from the metro areas of Chicago to New York ($5 million), Boston to New York ($3.5 million), and New York to Philadelphia ($3.5 million) rounded out the top five highest-grossing routes.
Demand is likely to keep these origins, destinations, and routes busy throughout the year, so it’s important for auto transport leaders to consider the need for lane optimization and strategic resource allocation. Knowing where the highest volumes and revenues are concentrated helps both shippers and carriers make informed decisions to maximize efficiency and profitability, especially in a market where every mile can directly impact profit margins.

Seasonal shifts in pricing and regional demand
Similarly, shifting seasonal demands drove volume and cost fluctuations across the nation. The report recorded October as the highest volume month of vehicle moves while August followed closely behind and saw the highest number of miles traveled last year.
Zeroing in on seasonal demands from a regional lens, cold-weather migrations drove a 15% winter surge in Florida-bound vehicle moves, while New York saw a 12% winter decline and Illinois fell by 9%. This indicates that winter weather can have a meaningful impact on vehicle movement. And, when looking at neutral climate states, such as Texas or California, auto transport was less impacted by the weather – Texas saw slight volume increases of 4% in the winter and California saw slight volume decreases of 3% in the winter.
As far as seasonal pricing goes, June was the most expensive month on record for vehicle transport with a $1.20 CPM equating to an average $580.71 per move, while November had the lowest fees of $1.15 CPM or $517.75 average per move. That’s just a $0.05 cent per mile difference, but when combined with the additional mileage in June, it equates to an 11% spread in cost and/or profit.
Weather patterns and other seasonal shifts can have a significant impact not just on volume and routes, but also on pricing and profitability. Shippers and carriers should monitor these patterns closely to adjust their planning, pricing strategies, and resource deployment in advance, especially during peak months and regional migrations, to maximize margins and reduce inefficiencies.
Shipping in bulk helped shippers cut cost
Bulk shipping proved a big money saver for shippers in 2024. The cost to ship one VIN averaged $0.66 per mile, while three-VIN shipments averaged $0.63 per mile, and six-VIN shipments averaged $0.49 per mile. A six-VIN shipment equates to a 26% price-per-mile savings when compared to single-vehicle moves.
While the overall cost of an order goes up with more vehicles, the cost per vehicle goes down, highlighting how important it is to maximize load capacity. By shipping multiple vehicles in a single order, shippers can lower their per-mile and per-unit costs, making multi-VIN shipments a smart and cost-effective strategy, especially for long-distance hauls.
SUVs and sedans lead the movement of cars
Consumer buying trends shaped the auto transport industry's moves in 2024. As SUV and sedan sales soared in new and used markets, these vehicles dominated the year’s transported vehicle list. SUVs accounted for 46% and sedans 29% of all vehicles moved last year.
Trucks and trailers were the third most transported vehicle category (17%), significantly outpacing the percentage of vans (6%), coupes (2%) and specialty vehicles like motorcycles, ATVs, and boats/RVs (less than 1%) transported through the Super Dispatch platform.
Tracking with the consistent nationwide popularity of Ford, Chevrolet, and Toyota trucks, SUVs, and sedans, these three brands topped Super Dispatch’s brands-moved chart. Ford led the brand pack with 15% of all moves, followed by Chevrolet’s 12% and Toyota’s 9% market share. Dodge held a respectable 7% and Nissan rounded out the top five brands moved at 6%.
Auto transport leaders could see shifts in vehicle sourcing and demand patterns. Understanding which vehicle types and brands are most commonly moved is vital for anticipating volume changes, adjusting logistics strategies, and staying competitive in a volatile market.
Disaster disruptions see quick rebounds
Severe weather phenomena continued to significantly disrupt the auto transport industry, with natural disasters and infrastructure failures affecting pricing, order volume, and VIN deliveries.
Hurricanes had the greatest impact on carrier operations in 2024, causing sharp drops in activity followed by rapid surges in demand. Looking specifically at three disasters – hurricanes Milton, Beryl, Helene – in the path of the industry’s most high-volume routes along the Southeast and Eastern coasts, day-of-disaster VIN delivery dropped by 43% (Milton), 21% (Beryl), and 18% (Helene). The report showed a positive recovery trend with activity rebounding to pre-storm levels after all three hurricanes within six days.
In comparison, tornadoes typically caused brief disruptions and saw faster recoveries, while wildfires resulted in erratic demand and slower rebounds, and infrastructure failures created immediate instability and led to prolonged pricing volatility.
Disruptions are an unavoidable reality, but proper plans can help carriers quickly adjust schedules and reposition assets. Pre-storm planning is critical. While activity may remain stable, or even spike, in the days before a storm, scheduling flexibility and proactive route planning are critical to avoid service disruptions once the disaster hits. Shippers should anticipate increased demand for transport capacity following disasters, making early post-disaster scheduling essential to avoid delays.
Industry players who understand and adapt to these data-backed trends and shifts will find success in identifying opportunities for both growth and savings, to ensure the road ahead is profitable, efficient, and as predictable as possible.


