The Vigillo data firm, which has about 2,000 trucking fleet customers for its compliance data mining and monitoring services, found in a recent analysis of its clients’ driver turnover data that fleets with the highest turnover rates generally have higher crash rates and poorer CSA scores than fleets with better driver turnover rates.
Speaking at Conversion Interactive Agency’s Recruiting and Retention in Nashville conference last week, Steve Bryan, president and founder of Vigillo, laid out the results for the audience of recruiters.
The analysis was meant to ask these questions, he said: Does high driver attrition impact CSA scores? And more to the point: “When you’re battling the turnover problem – does it matter?”
Setting aside CSA’s myriad of other issues — those that led Congress to revoke the CSA Safety Measurement System from public view and direct FMCSA to rework the system — Bryan urged his audience to consider what he sees as “strong correlations” between the broader “safety culture that exists in a motor carrier — I’m going to propose that it can be measured in CSA — and turnover rates.”
Vigillo’s service allows the company visibility into client carriers’ driver-employees as they enter and exit in the company’s database. He and data scientists at the company measured all client carriers’ turnover rates on the basis of such entries and exits, discarding those who fell in the middle and looking at the difference in compliance performance for equivalently-sized groups in the 25 percent with the highest turnover versus the 25 percent with the lowest turnover. Results showed that in all 9 analyzed metrics, high turnover carriers performed significantly worse than low-turnover carriers.
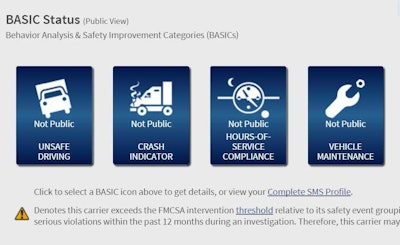
Here’s how the SMS scores in the seven CSA BASICs worked out, with high-attrition/turnover carriers represented by the orange bar in each pair, the low turnover fleets by the blue:
The differences were even more stark in metrics that drivers and carriers tend to trust as better correlating to safety performance, those outside of CSA BASIC scores, such as out-of-service inspections and volume of DOT-recordable crashes. High-turnover carriers had a “driver out-of-service rate 189 percent higher,” Bryan said, than low-turnover carriers. The vehicle OOS volume for those high-turnover carriers was 300 percent higher.

As regards reportable crashes, the high-turnover group showed 1,177 total. The low showed just 303, a huge difference.
“CSA hurts, turnover hurts,” Bryan concluded. “What I am hopefully bringing here is something you can take back to your company as a new lever. … You know your turnover, maybe you can use some of this information to help focus your companies in on how much the turnover/attrition rate can hurt you as a motor carrier in some aspects of safety.”