There is a lot of talk and uncertainty in our industry as to whether emissions regulations will change. California Air Resources Board (CARB) recently withdrew its waiver request for the Advanced Clean Fuel (ACF) rule, there is talk about the Advanced Clean Truck (ACT) being revoked, Greenhouse Gas (GHG) Phase 3 regulations being relaxed, and Environmental Protection Agency (EPA) 2027 Low NOx rules being relaxed.
If we are going to do some kind of reset, I would like to add a new topic to the list — “tank-to-wheel” vs “well-to-wheel” emissions. It is important to understand both terms and to reduce those emissions. It would be nice if both are considered for regulation. I think this could level the playing field for the alternative fuels and powertrains options, create healthy competition, and yield solutions in which both the environment and the economics win.
There are difference between the two types of measurements.
Tank-to-wheel (TTW)
This pertains to the emissions from the vehicle. It starts with the “fuel tank” and ends at the tailpipe. The “fuel tank” can be either the tank that holds the liquid or gaseous fuel (e.g. diesel, natural gas, renewable fuels, hydrogen, etc.), the battery, or potentially both on a plug-in hybrid vehicle. It reflects the emissions of criteria pollutants and greenhouse gases that are coming from the vehicle. Today’s regulations are measured at the TTW level. In the case of the EPA27 Low NOx rule, there is a threshold for NOx and particulate matter (PM). Greenhouse Gas Phase 3 sets a percentage reduction of CO2. ACT mandates perentages of zero-emission vehicles such as battery electric vehicles (BEV) or fuel cell electric vehicles (FCEV). TTW is relatively easy to measure for each individual vehicle.
Well-to-wheel (WTW)
This is a more comprehensive measurement of emissions than TTW because it reflects the “upstream emissions” plus the TTW. “Upstream” emissions” are generated when drilling, refining, or transporting fuels. If hydrogen is being produced, “upstream emissions” occur when the conversion to hydrogen takes place. WTW is much more challenging to measure for each vehicle and often requires estimations or approximations because of the complexity of the entire WTW system.
We need to understand how all the different fuels — diesel, natural gas, renewable fuels, hydrogen, electricity — are created. Many of them require significant energy to change from one state to another. And in most cases, where energy is consumed, emissions are released. For example, while it’s true that there is an abundance of hydrogen, it is not in a natural form that can be used to power a vehicle. A lot of heat and energy often are needed to transform hydrogen and many renewable fuels into a state where they can be used as fuel to power a vehicle.
I once talked to an expert from a utility company who told me that he asks people where electricity comes from, and the common answer is, “from the wall.” Clearly, we need better education as to how electricity and all forms of energy are generated. Concerned citizens and environmentalists should always be asking how the energy is created. A general rule is that if a lot of energy or heat is needed to get the fuel in the proper state, a lot of emissions are generated. This excludes examples where the energy is green.
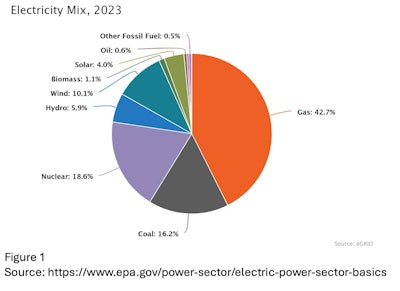
Figure 1 shows the grid make-up averaged for the entire United States. There are significant regional differences but this analysis is averaged nationally. We have approximately 40% of the “green stuff.” This is the sum of renewables such as solar, wind, hydroelectric and nuclear. While there are plans to grow this over the next decade, the current mix still is approximately 60% natural gas and coal. Some of the natural gas is in the form of renewable natural gas, which has negative carbon intensity and is great for the environment. But for the sake of this discussion, let’s simplify and assume 60% of the electric power source has emissions and CO2 content.
So, while BEV and fuel cell vehicles are zero-emission vehicles, they are only zero emissions from a TTW standpoint.
Which powertrain has the lowest WTW emissions?
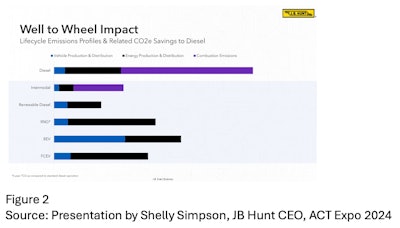
The answer to which powertrain has the lowest emissions from a WTW standpoint is, “It depends, and it is situational.” There are many studies, and each of them differ. A presentation by JB Hunt at last year’s ACT Expo shows that fleets are thinking about the total impact on the environment. The bar at the top shows diesel emissions. You can then see the relative emissions for intermodal, renewable diesel, renewable natural gas, BEV, and FCEV.
One thing we don’t talk a lot about is intermodal, but there are studies that say a 60% to 70% reduction in emissions can happen by shipping freight via intermodal.
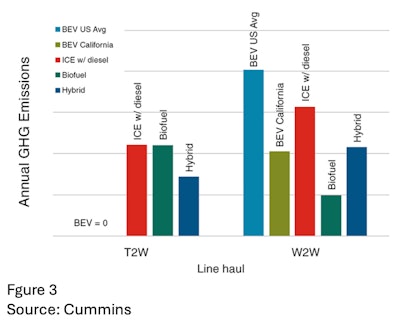
Cummins also published some estimates, illustrated in Figure 3. However there are studies that give different results and show that BEVs have lower emissions than ICE-powered vehicles even when considering the the grid with its mix of coal,natural gas, and renewables. The devil is in the detail so be aware that results can vary significantly, depending on the assumptions. I encourage everyone to ask a lot of questions about the “upstream emissions” and understand these nuances.
NACFE has done some work to help fleets think about regions of the country which are favorable to electrification from a grid emissions standpoint.
Is Well-to-Wheels perfect?
While I am pro-WTW, it is not the perfect solution. While TTW neglects the upstream emissions, and I believe that misleads the public, there are several deficiencies and/or challenges at looking only at WTW.
Local pollution and highly populated areas
We need to think about the emissions of a truck in the local communities in which it operates. Studies show that drayage routes and inner-city transportation have very high concentrations of pollution. These studies show high risk of respiratory illnesses (asthma, bronchitis, etc), heart disease, cancer, etc. In these locations, zero-emission vehicles are superior at addressing localized pollution, and we need more of these vehicles (or ultra-low emission vehicles) in these areas.
Regional complexity
There are complexities if we regulate only on a WTW basis. For example, in the northwest region, electricity is a high mix of renewables with a prevalence of hydroelectric power. Other parts of the country have high mixes of coal. While regulators can work with the utility companies, it would be very complex to try to improve WTW emissions for the trucking industry.
Measurement complexity
There are so many different types of fuels and processes to refine the fuels, and there are no common agreed-upon standards to measure emissions. CARB tries to do some standardizing with its carbon intensity assessment, but there certainly is a lot of work to turn these into regulated standards.
Differentiation is challenging
The energy sources often are combined in reservoirs, tanks, pipelines and grids, before reaching the vehicle making differentiating what a specific vehicle receives very challenging.
Full life-cycle analysis
One other element that has not been discussed pertains to the energy and emissions related to creating the equipment. For example, the energy (and hence emissions) needed to create an engine is different from the mining, processing, and manufacturing of a battery or a permanent magnet motor.
One way to think about challenges nos. 2 and 3 is the phrase, “If you can’t measure it, you can’t control it.” This is a principle that I have used throughout my career, and it applies to WTW regulation as well. TTW certainly is easier to measure and control.
The trucking industry is trying to balance clean air, decarbonization, and practical and economical powertrain solutions. There are many trade-offs. As we strive to find the right balance, we need to be educated on all the pros and cons, and WTW should be a part of this. NACFE is currently running a series of sessions that will help educate the industry. Sign up for NACFE Run on Less Messy Middle Bootcamp sessions. We will cover many of these topics.


