Tonnage up 0.9% in April
ATA index up 9.4% year-over-year
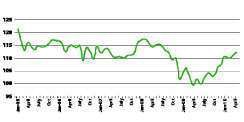
The American Trucking Associations’ advance seasonally adjusted For-Hire Truck Tonnage Index increased for the sixth time in the last seven months, gaining another 0.9 percent in April. The latest improvement put the SA index at 110.2, the highest level since September 2008. The nonseasonally adjusted index, which represents the change in tonnage actually hauled by fleets, equaled 111.3 in April, down 4.4 percent from the previous month.
 ATA’s Truck Tonnage Index -- ATA Chief Economist Bob Costello says tonnage is being boosted by robust manufacturing output and stronger retail sales.
Compared with April 2009, SA tonnage surged 9.4 percent, which was the fifth consecutive year-over-year gain and the largest increase since January 2005. Over the last seven months, the tonnage index grew a total of 6.5 percent. Year-to-date, tonnage was up 6 percent compared with the same period in 2009.
ATA Chief Economist Bob Costello says the latest tonnage reading fits with a sustained economic recovery. “Tonnage is being boosted by robust manufacturing output and stronger retail sales,” Costello says. “For most fleets, freight volumes feel better than reported tonnage because the supply situation, particularly in the truckload sector, is turning quickly.”
ATA calculates the tonnage index based on surveys from its membership. The report includes month-to-month and year-over-year results, relevant economic comparisons and key financial indicators. The baseline year is 2000.
IN BRIEF
* FTR Associates said May Class 8 truck total net orders for all major North American OEMs was 12,903 units, a 9.8 percent decline from April, while year-over-year comparisons showed a 74.7 percent improvement over May 2009. ACT Research Co. said April net orders for medium-duty Class 5-7 equipment grew by 39 percent but was hampered by continued weakness in the residential housing market and state budget constraints.
* Spot market freight availability increased 291 percent in April compared to the same month in 2009, according to TransCore’s North American Freight Index. Load volume was nearly 25 percent higher than in March. April’s spot freight volume was the highest in any single month since November 2005.
* Flying J Inc. announced that Comdata methods of payment now are accepted at more than 250 Flying J truckstop locations in the United States and Canada.
* Almost half of the respondents to a GE Capital Fleet Services survey – 48 percent – said cost savings is the main focus for fleet management in 2010 versus 36 percent from a 2009 survey.
* Multi Service Fuel Card added more than 400 truckstops to its rebate network in May. The program, which provides fleets with rebates of up to 10 cents on fuel gallons purchased within the network, now includes nearly 1,000 of the 3,200 truckstops accepting the Multi Service Fuel Card throughout the United States and Canada.
Year-over-year NAFTA trade up 37% in March
Trade using surface transportation between the United States and its North American Free Trade Agreement partners Canada and Mexico was 37 percent higher in March 2010 than in March 2009, reaching $69.9 billion, according to the Bureau of Transportation Statistics of the U.S. Department of Transportation. The increase is the largest year-over-year rise on record, but freight value in March 2010 still remained 1.2 percent less than the value in March 2008.
BTS, a part of the Research and Innovative Technology Administration, reported that the value of U.S. surface transportation trade with Canada and Mexico rose 17.6 percent in March 2010 from February 2010; month-to-month changes can be affected by seasonal variations and other factors. The value of U.S. surface transportation trade with Canada and Mexico in March was up 17.7 percent compared to March 2005, and up 33.6 percent compared to March 2000.
The TransBorder Freight Data are a unique subset of official U.S. foreign trade statistics released by the U.S. Census Bureau. Surface transportation consists largely of freight movements by truck, rail and pipeline; about 85 percent of U.S. trade by value with Canada and Mexico moves by land modes. n


