Trucking adds 5,900 jobs in July
The for-hire trucking industry continued to add jobs in July even as the overall U.S. economy lost jobs due to the wind-down of the federal government’s 2010 Census effort, according to preliminary figures released Aug. 6 by the U.S. Department of Labor’s Bureau of Labor Statistics. Payroll employment was up 5,900 over June, although that June figure had been revised downward by 1,700 from the figures BLS reported last month. Since the beginning of March, trucking companies have added 13,000 jobs, according to the preliminary numbers.
 Trucking companies added 5,900 jobs in July, but trucking employment was still down 1.1 percent from July 2009, according to the U.S. Department of Labor’s Bureau of Labor Statistics.
Year over year, payroll employment was down in July over July 2009 but only by 1.1 percent. Total employment was 1.24 million – down 213,000, or 14.7 percent, from peak trucking employment in January 2007. The BLS numbers reflect all payroll employment in for-hire trucking, but they don’t include trucking-related jobs in other industries, such as a truck driver for a private fleet. Nor do the numbers reflect the total amount of hiring since they only include new jobs, not replacements for existing positions.
Manufacturing orders dip in June
New orders for manufactured goods declined $5.1 billion, or 1.2 percent, in June compared to May, according to figures reported Aug. 3 by the U.S. Census Bureau. The drop in June followed a 1.8 percent decrease in May. Lower orders could indicate a softening in demand for trucks in the near future.
Shipments also were down slightly in June following a decline in May that mirrored the drop in new orders. Unfilled orders were down slightly in June following two consecutive monthly increases. The ratio of unfilled orders-to-shipments was 5.6, down from 5.61 in May.
Although the orders figures weren’t good news for trucking, the trend in inventories was, although only moderately so. Inventories edged slightly lower – 0.1 percent – in June following a 0.4 percent decrease in May.
New orders for manufactured durable goods were down 1.2 percent in June, while orders for nondurable goods fell 1.3 percent. In June, the largest decline was in transportation equipment, which dropped 2 percent and has fallen in four of the last five months.
Nationwide, the overall jobs picture continues to suffer from the end of the temporary jobs that were created to complete the Census. Total nonfarm payroll employment declined by 131,000 in July, primarily because 143,000 temporary Census workers completed their work. Private-sector payroll employment edged up by 71,000.
IN BRIEF
* Only two publicly traded trucking companies – LTL carrier Arkansas Best Corp. and refrigerated truckload/LTL carrier Frozen Food Express Industries Inc. – failed to post an operating profit in the quarter ended June 30. The only carrier to see a decline in revenues compared to the same 2009 quarter was YRC Worldwide, but the LTL giant posted a $48.3 million operating profit due to a 30 percent decline in expenses.
* Personal income and disposable personal income both increased less than 0.1 percent, and personal consumption expenditures, or consumer spending, declined less than 0.1 percent in June compared to May, according to estimates released by the Bureau of Economic Analysis.
* The Freight Transportation Services Index edged up slightly in June after a one-month decline – rising 0.2 percent over its May level, according to preliminary numbers released by the U.S. Department of Transportation’s Bureau of Transportation Statistics. The Freight TSI is up 4.7 percent over the last 13 months after declining 15.3 percent in the previous 10 months. The baseline year is 2000.
* Trade using surface transportation between the United States and its North American Free Trade Agreement partners Canada and Mexico was 39.5 percent higher in May 2010 than in May 2009, reaching $66.8 billion, according to the Bureau of Transportation Statistics of the U.S. Department of Transportation. The 39.5 percent increase was the largest-percentage year-over-year increase in total U.S.-NAFTA trade by surface modes on record back to April 1994.
Tonnage index falls in June
The American Trucking Associations’ advance seasonally adjusted For-Hire Truck Tonnage Index decreased 1.4 percent in June, although May’s reduction was revised from 0.6 percent to just 0.1 percent. May and June marked the first back-to-back contractions since March and April 2009.
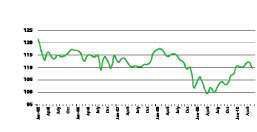 ATA'S TRUCK TONNAGE INDEX. (Seasonally adjusted: 2000 = 100)
The latest reduction lowered the SA index from 110.1 in May to 108.5 in June. The nonseasonally adjusted index, which represents the change in tonnage actually hauled by the fleets before any seasonal adjustment, equaled 115.9 in June, up 6.5 percent from the previous month. Compared with June 2009, SA tonnage climbed 7.6 percent, which was just below May’s 7.7 percent increase and the seventh consecutive year-over-year gain. Year-to-date, tonnage is up 6.6 percent compared with the same period in 2009.
ATA Chief Economist Bob Costello says the two sequential decreases reflect an economy that is slowing, and that tonnage growth is likely to moderate in the months ahead as the economy decelerates and year-over-year comparisons become more difficult. Nevertheless, Costello believes that tonnage doesn’t have to grow quickly at this point since industry capacity has declined so much. “Due to supply tightness in the market, any tonnage growth feels significantly better for fleets than one might expect,” he says.
ATA calculates the tonnage index based on surveys from its membership. The report includes month-to-month and year-over-year results, relevant economic comparisons and key financial indicators. The baseline year is 2000. n


