After Central Pennsylvania Transportation analyzed the volume of a top customer, the Lancaster-based company determined that some lanes were unprofitable and no longer could be serviced unless rates increased by more than 100 percent.
“When you look at everything, sometimes you are spending money just to keep the business,” says Thorny Embly, vice president of the 90-truck carrier. “If we are keeping trucks moving and making a small amount of profit, we are willing to hold the rate, but we are no longer willing to lose money.”
During the recession, CPT – like most carriers – knowingly lost money in some lanes to keep its assets moving and retain customer goodwill. No carrier enters into agreements to lose money, but things seldom happen according to plan – especially when freight is soft.
With freight volumes improving today, most carriers are in no hurry to add capacity. Instead, fleet executives are identifying their unprofitable and low-margin business and negotiating with customers for better rates and freight selection.
The latest technology gives fleet managers and executives the ability to analyze multiple dimensions of their business and, more importantly, make the necessary changes to improve profitability while they have the upper hand.
Digging deeper
The traditional approach of analyzing costs and revenues on a per-mile basis allows fleets to compare their own driver pay, fuel, revenue and other key indicators to those of the marketplace.
PCS Software’s Express dispatch and accounting system has various financial reports to measure all direct and indirect costs – such as administration and overhead – on a per-mile basis. Even items like advertising budgets, uniforms, rent and other overhead can be measured constantly by the mile. “Essentially, you can see cost per mile for anything that you have established an expense account for, right on the P&L,” says Sean VanDyck, PCS Software sales manager.
Business profitability is also a function of time – not just miles. What is the impact to profitability of a bad appointment time, traffic congestion, poor utilization of driver hours and layovers?
During the height of the recession in 2009, cost containment became the top initiative for RT&T Enterprises. Management analyzed every line item on the company’s profit-and-loss reports and benchmarked costs and revenues on a per-mile basis. In mid-2009, RT&T purchased the Profitability Analysis module from McLeod Software to gain a deeper understanding of its business. The new module provided the carrier with a new metric called “load velocity.”
“We never had the ability to tie to velocity to see how many hours were invested, for instance, in a regional versus an over-the-road shipment,” says Todd Collins, president of the East Dubuque, Ill.-based company.
The Profitability Analysis module uses the fleet’s actual pickup-and-delivery information captured by its McLeod LoadMaster dispatch and enterprise management software system. For each load, the module allocates all costs by the hour and by the mile for fuel, payroll and other items – giving a complete view of profitability by lane and by customer.
RT&T Enterprises now can identify underperforming lanes and work with customers to scrub them from its portfolio. “Having a P&L on each lane lets me do what I’m good at,” Collins says. “We are also able to give rate reductions in lanes with good velocity.”
With some additional analysis, load velocity – or hours per load – can be converted to a measure for the per-minute cost or profitability of a shipment. Fleets also can use the Profitability Analysis module to see operating ratio by commodity, customer and day of the week, says Randy Seals, division manager of customer advocacy for McLeod Software.
Evaluating the network
Besides analyzing revenues and costs on a mileage and time basis, some carriers are able to evaluate each load within their overall system or network. Few fleets operate in an out-and-back environment with every load counted as a head haul or backhaul. “It doesn’t take long before your network becomes too complicated to wrap your head around,” says John Barker, operations manager of Jacobson Companies.
Like most carriers the past couple of years, Jacobson Companies has had to cut costs and remove unprofitable business. The Des Moines, Iowa-based company operates a 165-truck over-the-road fleet, as well as warehousing, dedicated and third-party logistics services.
In March, Jacobson Companies implemented IDSC Netwise from TMW Systems to better evaluate and manage its freight mix, lanes and customer profitability. Since using IDSC Netwise, Jacobson Companies has implemented rate changes, discontinued lanes and sent its sales force out in search of more profitable lanes.
“We have gone to customers and requested changes to increase utilization, such as appointment changes and dropped trailers, and just about every way you can name that you can go about improving a network,” Barker says.
Jacobson Companies uses a Netwise measurement index called yield to evaluate loads in its network. Yield is a function of revenue, time, cost and freight flow. Netwise shows which of these elements need to improve to have the most impact on the bottom line.
The software includes a market rate index, which Barker uses to analyze revenues for current and prospective freight. It also shows the profitability impact of time for each shipment due to delays at origins, at destinations and in transit. With this information, two pieces of business may need to be priced differently in the same lane due to factors such as excessive load and unload times and appointments.
“Those two pieces of business do not have the same value to the network,” Barker says. “Yield is the piece that puts it all together for you.”
Jacobson Companies once used a full-time analyst who might have spent five weeks to analyze three months of business, but with Netwise, Barker says he can do the same analysis in 15 minutes. Every week, he and other managers use the information to identify low-margin and low-yield business and formulate action plans to improve them. Since implementing Netwise, the company has improved margin and yield by more than 30 percent, he says.
Comparing to plan
The profitability analysis tools used by an irregular-route truckload carrier differ significantly from those used by a fleet with static routes – such as dedicated operations – or a fleet with multiple pickups and deliveries assigned to a route. For less-than-truckload and private fleets, determining which customer or lane to serve is only part of the equation; figuring out the most profitable route, delivery sequence and performance standard is just as critical.
A key measure for Avalon Foodservice is the time vehicles and drivers spend at customer locations. The Canal Fulton, Ohio-based company uses routing software to plan about 900 deliveries a week for its 26 power units. To monitor delivery performance for its route plan, the company uses a mobile fleet management system from Trackwell ADS. The system captures the time, position and mileage data and compares this to the routing plan for mileage and arrival, departure and stop times.
If a delivery takes longer than planned, the fleet can give salespeople reports from Trackwell ADS to share with customers and discuss ways to speed delivery time. In some cases, delays may result from customers not knowing when the driver will arrive. To correct this, Avalon Foodservice eventually plans to send real-time updates to customers for its arrival times.
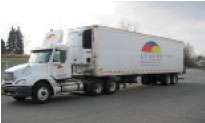 Avalon Foodservice uses a mobile fleet management system from Trackwell ADS to monitor delivery performance for its route plan.
Profitability for most fleets depends on the time spent at stops, whether or not the fleet is in the business of delivering freight. A construction company that schedules an onsite job to last two hours can tie its profitability directly to how long the transaction took versus what was quoted to the customer.
By setting up a geofence – an imaginary perimeter around the location – an onboard system can trigger an alert if a vehicle or employee is at a customer location for more than the specified time period, says Tony Lourakis, chief executive officer of Complete Innovations, which offers the Fleet Complete tracking and dispatch system.
Before implementing Fleet Complete, Anglia Steel – which manufactures and erects steel structures for buildings – had no idea what its welders and technicians were doing with company trucks. Were trucks being used after regular work hours, or were they leaving a jobsite during the middle of the day?
“We nipped it quickly,” says Terrence Schofield, safety officer for the Calgary, Alberta-based company. “Now we know that vehicles are used specifically for business use.”
Down to details
The latest features in mobile computing and wireless communications technology can help fleets analyze historical and real-time information to get a detailed prescription of how to improve the profitability of assigned routes and deliveries.
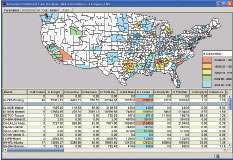 McLeod Software’s Inbound/Outbound Lane Analysis Tool helps users visualize businesses’ traffic flow to determine the origin and destination of most orders, revenue and billed miles.
PeopleNet’s Link platform is a reporting tool used by many fleets to compare their planned versus actual travel times and stop times by customer. PeopleNet Link gives users the flexibility to customize their reporting to identify the customers with the most exceptions for planned versus actual stop times.
PeopleNet customers can capture additional activities for each stop using a product called BLU Workflow. Users can customize forms with dropdown menus that prompt drivers to capture the time spent loading, unloading or waiting at the dock.
“Historically, it was all about miles and time,” says Brian McLaughlin, chief operating officer. “Now, fleets want to get a tight grip on how drivers are performing.”
Last year, Xata launched Fleet Performance Manager, a dashboard-style reporting and analytics package for its Web-based Xatanet fleet management system. Users can pick from among 40 different key performance indicators to monitor performance against targets for utilization, fuel economy, customer service, safety and compliance, among other categories.
“It doesn’t take long before your network becomes too complicated to wrap your head around. ”
– John Barker, operations manager, Jacobson Companies
For profitability analysis, a Xata customer could take a KPI, such as the number of cases or pallets delivered per day, and drill it down to the transaction level. A fleet could see the transactions for a customer and calculate delivery costs on a per-item basis, says Charlie Mohn, product marketing manager.
Earlier this year, Qualcomm Enterprise Services released its Circle of Service Workflow application that integrates with dispatch systems to capture information from drivers such as over, short and damaged freight and the quantity of packages or freight delivered at each stop.
Circle of Service Workflow can present forms to drivers with specific instructions based on their proximity to landmarks such as customers and fuel stops. The application forces drivers to acknowledge what they are doing and to capture additional information that can be used in comparing planned versus actual performance. QES has developed Circle of Service Workflow templates for various operational profiles such as grocery haulers and tankers, says Chris Silver, senior manager of product marketing.
With more freight to choose from, fleet managers that leverage robust data capture and analysis tools are able to determine what equipment to assign to each customer, lane and type of freight – and operate at full speed on the pathway to recovery. n

