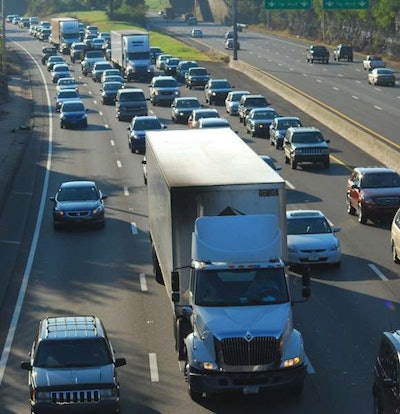
National levels of traffic congestion increased by 7.4 percent from July 2012 to July 2013, and the average trip took drivers in the 100 most populated metro areas more than 6 percent longer due to increased traffic.
July’s traffic congestion data also summarized regional trends:
• Midwest: greatest rise in traffic congestion as 72 percent of its most populated metro areas saw year-over-year traffic increases in July.
• Northeast: increase in traffic congestion in 58 percent of its most populated metro areas. Philadelphia’s 20 percent year-over-year increase aligns with recent news of increased manufacturing activity in the area.
• West: increase for 52 percent and decrease for 48 percent of the most populated areas for July year-over-year traffic growth. The San Francisco metro area’s increase of 35 percent was due in part to a short-lived transit strike in July, most of it was likely caused by the strength of the region’s ongoing boom which is also reflected in record real estate prices.
• South: 54 percent of its most populated metro areas experienced year-over-year traffic growth in July.


