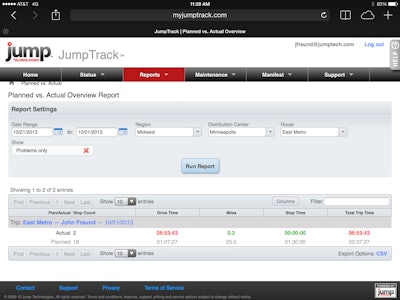
 Jumptrack’s planned vs. actual report
Jump Technologies, a software provider that combines smart technology with cloud computing for supply-chain management applications, announced a planned vs. actual reporting enhancement for its JumpTrack proof-of-delivery (POD) product. The enhancement provides fleet management and dispatch insight about their drivers’ delivery efficiency.
JumpTrack is available on standard iOS and Android platforms to work independently or as an accessory to more traditional in-cab computing platforms.
“Our new planned vs. actual report compares drivers’ actual delivery performance against a dispatch or JumpTrack-generated route in key areas such as route leg time, leg distance, arrival time, stop time, departure time, stop order, total route time and distance,” says John Freund, Jump Technologies president and CEO. “This critical information allows companies to manage by exception by highlighting delivery problems and inefficiencies.”
Fleets upload a list of pickup and delivery stops from a spreadsheet or a more automated manifest system to JumpTrack’s cloud-based platform in the order they plan to make them. Using its mapping database and other tools, JumpTrack shows what time the driver should arrive at each stop based on the stop order.
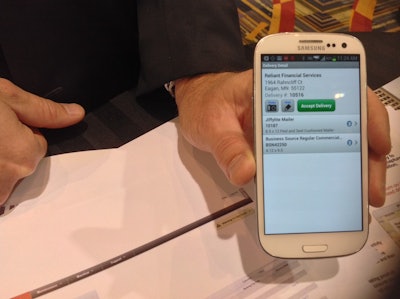 Drivers can quickly process pickup and delivery information using a mobile app
JumpTrack automatically sets a default geofence, or virtual perimeter, around each location to capture arrival and departure events, Freund says. Using this and other information, fleets are able to automatically satisfy their customer requests for accurate arrival times and real-time tracking as long as customers have an Internet connection.
The cloud application costs between $20 and $65 per truck a month, depending on fleet size.
Users can customize the planned vs. actual report to receive the information they want—from a high level that identifies a lag in performance to more granular details, such as stop count, drive time, lag time between stops, miles, departure time, stop time, and total trip time. These details provide insight into areas that when fine-tuned increase fleet efficiencies and decrease costs. Sophisticated mapping technology allows the customer to view actual trips, and to view additional parameters based on geo-fencing.
Delivery site editing allows customers to correct bad data. For example, if a customer’s database contains outdated or bad addresses, a user can define a site geo-code on a map to these invalid addresses. In addition, customers can change geo-fencing parameters to indicate specific locations for deliveries.


