Below is a sampling of key slides from “Modifying the Compliance, Safety, Accountability Program Would Improve the Ability to Identify High Risk Carriers,” a U.S. Government Accountability Office report published Feb. 3.
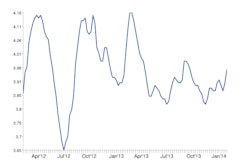
 Figure 1 shows that violation rates tend to vary by a larger amount across carriers with few inspections than across carriers with more inspections. As a consequence, a high estimated violation rate for a carrier with few inspections may reflect greater safety risk, an imprecise estimate, or both. (Click to enlarge)
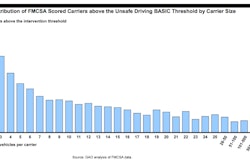
 Figure 2 shows that among carriers for which the GAO calculated a violation rate using FMCSA’s method for the Unsafe Driving BASIC, carriers that operate fewer vehicles, for example fewer than 5, experience a greater range in violation rates per vehicle than carriers operating more vehicles, for example, greater than 100. (Click to enlarge)
 FMCSA’s Hours-of- Service Compliance BASIC has five safety event groups. The group of carriers with the fewest number of inspections in each safety event group tends to have a higher percentage of carriers identified as above the intervention threshold than the group of carriers with a greater number of inspections. This suggests that FMCSA’s methodology is not adequately accounting for differences in exposure, as it is intended to do, but rather is systematically assigning higher scores for carriers with fewer inspections. (Click to enlarge)
 Figure 4 shows that, among carriers that received an SMS score in Unsafe Driving, carriers with fewer than 20 vehicles are more than 3 times as likely to be identified as above the intervention threshold than carriers with 20 or more vehicles. (Click to enlarge)
 Figure 5 shows for five out of six BASICs, the Crash Indicator, and the high-risk designation, the GAO alternative scoring method identified a higher percentage of individual carriers above the intervention threshold that actually crashed compared with FMCSA’s existing method. (Click to enlarge)