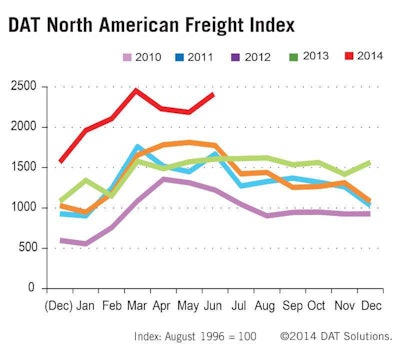
Freight availability on the spot market was 50 percent higher in June compared to the same month the previous year, continuing a pattern of elevated activity in 2014, according to the DAT North American Freight Index, a measure of truckload freight demand and capacity in the United States and Canada. That surge was backed by an upturn in the economy, as the Federal Reserve reported Wednesday.
The year-over-year increase in the DAT index was reflected in all three major equipment types: Van loads grew 39 percent, refrigerated freight was up 51 percent, and flatbed volume rose 69 percent. (Slide 1)
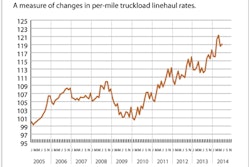
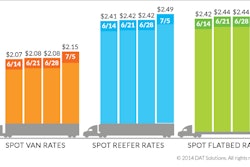
For truckload rates, greater demand along with constrained capacity contributed to an increase in June. Compared to June 2013, the national average rate was up 15 percent for vans, 10 percent for reefers, and 14 percent for flatbeds.
Compared to the prior month, spot freight volume increased 9.8 percent in June. Van (Slide 2) and reefer (Slide 3) freight each were up 20 percent, while flatbed freight (Slide 4) volume gained 3.7 percent. Spot truckload rate increases were more modest: the average van rate rose 7.4 percent, reefers increased 6 percent, and flatbeds saw a 4.4 percent increase compared to the previous month.
Several factors appear to have contributed to record-high volume and rates on the spot truckload market this year, including disruptive weather, an improved economy and seasonal fluctuations of freight and capacity, DAT says.
Indeed, industrial production climbed 0.2 percent in June, capping off a quarter that saw the annualized gain in output from factories, mines and utilities climb to 5.5 percent, the best quarter in almost four years, according to the Federal Reserve’s report released Wednesday. (Slides 5, 6)
Similarly, the Federal Reserve Board’s latest Beige Book, as survey of economic trends, reported that manufacturing activity expanded in all 12 banking districts. Likewise, overall transportation activity rose at a moderate pace since the previous survey period, with broad-based demand increasing for trucking and rail services across all districts.
As a result, shippers have increasingly relied on third-party logistics providers to meet the needs caused by the growing volume of exception freight, DAT notes.
Second quarter volume increased overall by 4.9 percent compared to Q1, reflecting a typical seasonal pattern.
Reference rates are derived from DAT RateView. Rates are cited for line haul only, excluding fuel surcharges, which declined on a month-over-month basis but increased compared to June 2013.
The monthly DAT North American Freight Index reflects spot market freight availability on the DAT Network of load boards in the United States and Canada. Additional trends and analysis are available at DAT Trendlines.


![DesignWall&Seatst-5031(RGB-300dpi)[1]](https://img.ccjdigital.com/files/base/randallreilly/all/image/2014/07/ccj.DesignWallSeatst-5031RGB-300dpi1.png?auto=format%2Ccompress&fit=crop&h=167&q=70&w=250)


