On average, Class 8 trucks in this market have less usage — in terms of miles and hours driven — than long-haul applications. Lighter weight components would lower the cost of trucks and increase fuel efficiency, but would there be trade offs in durability?
If the design process had started in 2013 or even 2014, Navistar would likely have had to conduct an expensive market study to test the design concept. In 2015 it had an analytics team and big data to make the decision.
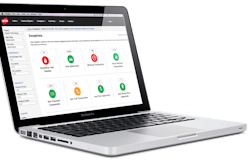
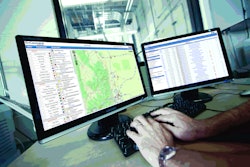
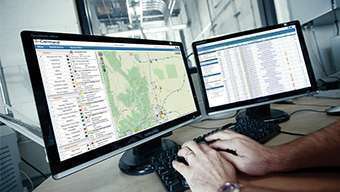
The analytics team came together after Navistar rolled out its remote diagnostics system, OnCommand Connection, in 2014. The system gives the company access to vehicle and engine data, on all makes and models, by interfacing with telematics systems that fleet customers use such as PeopleNet and Omnitracs.
An interesting pattern emerged by studying data from customers in the regional market. The fleets were indeed using trucks less frequently compared to customers in the long-haul market, but for very severe purposes like pulling trailers through corn fields during the harvest season.
“Those are things you don’t think of,” says Andy Minteer, director of IoT analytics and machine learning for International Truck.
These and other market insights helped the company avoid further design costs and potential future problems with lighter duty Class 8 vehicles, he says.
Besides supporting internal customers in truck design and engineering, the analytics group uses advanced statistics and machine learning to turn big data into beneficial information for external customers.
For example, the analytics team has created a predictive model that identifies potential maintenance issues for customers, often before “check engine” lights appear. The model predicts failures for more than 40,000 combinations of diagnostic trouble codes (DTCs) by make, model and year of vehicle.
The model is run weekly. Customers receive an alert if any equipment has a DTC, or combination of DTCs, that is above the danger area for an imminent failure. When such alerts are found for International trucks, a customer service group can address the problem directly with the fleet customer. Alerts also give customers insights and recommendations for trucks from all other OEMs, Minteer says.

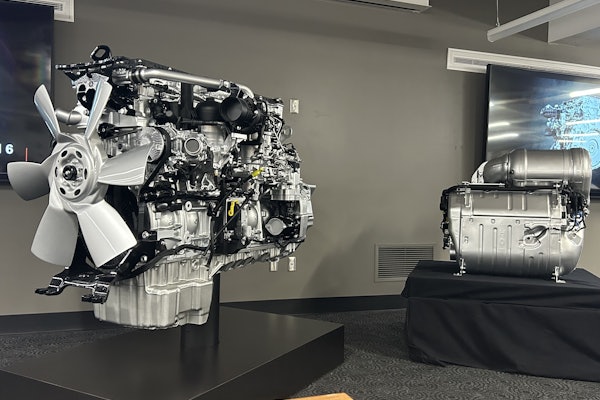
Eight different subgroups emerged from this analysis. One example is what Dan Pikelny, vice president of analytics, refers to as the “high usage” group of vehicles. A particular emissions component in this group of vehicles with high miles and high hours showed an accelerating failure rate. This trend was not present in other groups.
With this insight, the group identified the top fleets who were starting to experience the trouble code. The customer service team contacted the customers to set up a proactive repair program to change the part before it failed, he says.
The analytics group has also identified several dozen “synthetic” fault codes. As the name suggests, these fault codes do not appear naturally; they are based on a combination of faults known to have an elevated risk of failure and are communicated to customers to make proactive repairs.
All of the data coming through the OnCommand system and analysis amounts to about 1 terabyte (TB) per week. To manage this, Navistar’s analytics team uses big data technology from Hadoop and SAS and a variety of open source statistical programming languages (R, Gib and Python) for the analytical processing.
Once the processing is complete, they use Tableau software for data visualization, Pikelny says.
Rather than invest in computing resources in house, the company uses Amazon web services to pay for use of a high powered server, on demand.
“That chain of technologies has really given us a lot of capability at a much lower cost than a traditional data warehouse,” he says.


