 (Photo by Jim Allen/365 Trucking)
Higher spending on driver wages and benefits, as well as increasing fuel costs, caused carriers’ per-mile operational costs to climb nearly a dime in 2017 compared to 2016, according to an annual report by the American Transportation Research Institute.
Data from ATRI’s 2018 “Operational Costs of Trucking” show carriers’ per-mile spending rose 6.2 percent on average, or 9.9 cents a mile. Spending on driver wages grew the most year to year and accounted for the highest per-mile expenditure. On average, the carriers surveyed spent 3.4 cents more per mile on driver wages in 2017 than in 2016 and 1.7 cents per mile more on driver benefits. Together, spending on driver benefits and driver wages accounted for more than half (5.2 cents) of the year-to-year increase in per-mile spending.
Carriers spent on average spent 55.7 cents a mile on driver wages in 2017, compared to 2016’s 52.3 cents a mile. Per-mile costs of driver benefits was 17.2 cents a mile, up from 2016’s 15.5 cents. Combined, the two accounted for 43.1 percent of carriers’ per-mile costs. This is the third consecutive year that driver wages ranked as the No. 1 cost for carriers.
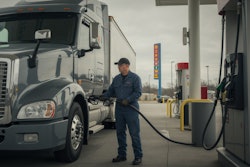
Per-mile fuel costs also climbed in 2017. Carriers on average spent 36.8 cents a mile on fuel in 2017, according to ATRI’s data, compared to 33.6 cents a mile in 2016. Expenditures on truck and trailer leasing and purchases saw a small increase — nine-tenths of a cent — to 26.4 cents a mile.
Upcoming Event

2019 CCJ Solutions Summit: Making Money in a Changing Market
With sessions at the event around:
» Improving your equipment life cycle;
» Turning your maintenance department into a profit center;
» Losing the customers you lose money on;
» Making money off the data you already generate;
» and more,
CCJ Solutions Summit will give you critical information to take your business to the next level. Join us, November 18-20, in Scottsdale, Arizona.
Register today.
Unlike in years past, none of carriers’ per-mile costs dropped year to year.
ATRI’s report cites driver recruiting and retention efforts as prime reasons for the higher wages and better benefits. Bonus pay also played a role in driving up those costs, ATRI notes. The firm projects compensation-related spending to surge even further in 2018, due to the industry‘s tight capacity and extra focus on driver recruiting and retention. It also expects fuel spending to continue to climb, too.
Survey respondent demographics
As in years past, ATRI doesn’t say how many carriers it surveyed. However, survey respondents accounted for 178,936 tractor-trailers and thousands more straight trucks. See the chart to the right that breaks down the respondents by fleet size. Nearly 40 percent of the carriers who participated in the survey operate trips of 500 miles or longer. Thirty-seven percent are regional carriers, operating trips between 100 and 500 miles. A quarter of the respondents were local pickup and delivery drivers.
The tractor-trailer carriers surveyed average more than 89,000 miles a year per truck.


