The largest fleets in the country took a hammering almost uniformly in Q3 of 2023, even after many took steps to stave off bleeding in Q2. It's no secret why: The market is rough out there. "Continued softness" of the market comes up again and again as a recurring theme, but in that softness comes a lesson on what to do when the chips are down.
Fleets like Saia and XPO actually grew revenue, even while profits lagged. Fleets with recent big acquisitions may have struggled to run all those trucks profitably, and now they look to Q4's peak season to lift earnings.
Take a look at the good bad and ugly in fleet earnings below.
Covenant's smaller fleet still struggling
After bleeding tractors and trailers in Q2, Covenant (CCJ Top 250, No. 38) saw a "very challenging freight market that has continued into the fourth quarter of 2023," according to CEO David R. Parker.
“Our asset-based segments contributed approximately 67% of total revenue, 69% of operating income, 63% of total freight revenue, and 72% of adjusted operating income in the quarter. Our Expedited segment experienced comparable freight revenue with approximately 2% fewer tractors, but experienced diminished margins compared to the third quarter last year. Our Dedicated segment experienced reduced freight revenue with approximately 12% fewer tractors and improved margins year over year," he continued.
The asset-light segment, with 33% of total revenue "experienced significant reductions in both revenue and profitability with little to no project related freight in the current quarter," said Parker, who pointed to "focused sales efforts" as a potential way to improve margins.
Revenue: 2023 Q3: $288.7 million vs. 2022 Q3: $311.8 million
2023 YTD: $829.6 million vs 2022 YTD: $920.8 million
Income: 2023 Q3: $13.5 million vs. 2022 Q3: $50.5 million
2023 YTD: $42.4 million vs 2022 YTD: $97.2 million
–
Forward Air Corporation sees 'softer demand'
Forward Air Corporation (No. 50) saw revenue and income down versus last year, but Tom Schmitt, Chairman, President and CEO remained upbeat, saying the company had seen growth in LTL operating ratio and growing domestic freight forwarder and direct shipping customer bases.
“Market demand continues to be challenged for our intermodal and truckload brokerage services as both lines of business are navigating an extended weak freight environment. Softer demand for our intermodal and truckload brokerage services combined with a decrease in the price of diesel over the same period in the prior year resulted in a 19% decline in revenues on a consolidated basis," CFO Rebecca R. Garbick said.
Revenue: 2023 Q3: $413.5 million vs. 2022 Q3: $510 million
2023 YTD: $1.24 billion vs. 2022 YTD: $1.49 billion
Income: 2023 Q3: $15.5 million vs. 2022 Q3: $71.7 million
2023 YTD: $96.2 million vs. 2022 YTD: $204.6 million
–
Heartland Express bleeding cash after acquisitions
Heartland Express (No. 42) managed to grow revenue over Q3 of 2022, but whereas by that time last year the company had made nearly $120 million in profit, this year it's just under $10 million after losing nearly $11 million this quarter.
CEO Mike Gerdin offered the following explanation: "Our consolidated operating results for the three and nine months ended September 30, 2023 reflect the combination of a weak freight environment along with strategic operational changes implemented. These strategic changes targeted unprofitable customers and lanes of freight that were not acceptable for the long term profitability of our organization. These decisions, while difficult, were made to set a course for the future to ensure that we are prepared to capitalize on stronger freight demand with more efficient operations in the future."
As for the acqusitions of Smith Transport and CFI, Gerdin said he's hopeful for the future, but "the operating challenges following these acquisitions combined with the significant headwinds of the current freight environment and rising fuel costs have hindered our financial performance during the third quarter of 2023."
Revenue: 2023 Q3: $295 million vs. 2022 Q3 $273.9 million
2023 YTD: $932.1 million vs 2022 YTD: $613.1 million
Income: 2023 Q3: $(10.7) million vs. 2022 Q3: $24.4 million
2023 YTD: $9.7 million vs 2022 YTD: $118.1 million
–
J.B. Hunt's Marketplace continues free fall
J.B. Hunt (No. 3) saw revenue drop 18% and income down 33% since Q3 of 2022, mostly due to "lower revenue across all business segments, higher equipment-related costs, and higher insurance and claims expense compared to third quarter 2022," according to the company.
Most notably, the company's Marketplace digital freight brokerage has fallen to just $169 million in revenue, as opposed to $391 million i Q3 2022.
Revenue: 2023 Q3: $3.16 billion vs. 2022 Q3: $3.83 billion
2023 YTD: $9.53 billion vs 2022 YTD: $11.16 billion
Income: 2023 Q3: $241.7 million vs. 2022 Q3: $362.2 million
2023 YTD: $548.2 million vs 2022 YTD: $687.4 million
–
Knight-Swift Transportation 'stable at low levels'
Knight-Swift (No. 4) saw a pretty rough quarter with operating ratios approaching, and passing 100% across the major segments.
CEO David Jackson said ""Freight demand remains stable at low levels in the truckload market and relatively strong in the less-than-truckload market ("LTL"). Considerable truckload rate and cost pressure continue to mount as the truckload over-supply continues to rationalize and the industry approaches equilibrium. With truckload pricing resets now largely realized across our book of business combined with the recent climb in fuel prices serving as sequential headwinds to operating margins, our efforts to cut additional costs helped to improve the operating ratio slightly from the second quarter in our truckload business prior to the inclusion of U.S. Xpress."
Revenue: 2023 Q3: $2.01 billion vs. 2022 Q3: $1.89 billion
2023 YTD: $5.2 billion vs. 2022 YTD: $5.68 billion
Income: 2023 Q3: $81.1 million vs. 2022 Q3: $265.4 million
2023 YTD: $319.8 million vs. 2022 YTD: $889.3 million
–
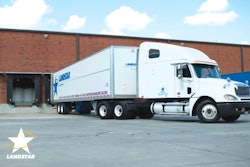
Landstar says it's worse than pre-pandemic
Landstar (No. 9) sees itself stuck in the doldrums with another quarter of soft demand. The nearly 40% drop in income vs 2022 sounds harsh, but it's more or less in line with the rest of the industry now.
Jim Gattoni, the company's CEO at the time of its last quarterly results, said "the number of loads hauled via truck has trended below historical, pre-pandemic end of third quarter to the beginning of fourth quarter sequential patterns, while truck revenue per load has thus far trended reasonably in-line with these historical, pre-pandemic sequential patterns."
“Lackluster demand, driven by continued weakness in the U.S. manufacturing sector and the ongoing impact of an inflation-challenged consumer goods sector, plus the continuation of a loose truck capacity market drove Landstar’s truck revenue per load and volumes in the 2023 third quarter below prior year levels," he continued.
Revenue: 2023 Q3: $1.29 billion vs. 2022 Q3: $1.82 billion
2023 YTD: $4.1 billion vs. 2022 YTD: $5.76 billion
Income: 2023 Q3: $80.3 million vs. 2022 Q3: $133.5 million
2023 YTD: $269.6 million vs. 2022 YTD: $446.7 million
–
Marten Transport focuses on 'minimizing' pain
Marten Transport (No. 40) saw revenue dip almost 14% and income down nearly 30% in a rough quarter.
“Our earnings this quarter were significantly pressured by the industry-wide weak demand, cumulative impact of reduced freight rates with the resulting freight network disruption, and inflationary operating costs within the current freight market recession. Additionally, the record heat and rising fuel prices each month of the third quarter led to an increase in our mile-adjusted net fuel expense of $3.9 million, or 4 cents per diluted share, from this year’s second quarter to third quarter," said Executive Chairman Randolph L. Marten.
“We are focused on both minimizing the current freight market’s impact on our operations, and investing in and positioning our premium service solutions to capitalize on profitable organic growth opportunities as the market necessarily recovers - with fair compensation for our services. To that end, we have not agreed to any rate reductions since early August.”
Revenue: 2023 Q3: $279.5 million vs. 2022 Q3: $324.4 million
2023 YTD: $863.2 million vs. 2022 YTD: $941.3 million
Income: 2023 Q3: $28.2 million vs. 2022 Q3: $40.9 million
2023 YTD: $74.5 million vs. 2022 YTD: $110.6 million
–
Old Dominion Freight Line sees 'encouraging trends'
Old Dominion (No. 10) saw only modest drops in revenue and income, just losing 5.5% of revenue, mostly to a 6.9% decrease in LTL tons per day. Overall, the company improved operating ratio by 1.5%.
"Old Dominion’s third quarter financial results reflect continued softness in the domestic economy but also a number of encouraging trends," Marty Freeman, President and Chief Executive Officer of Old Dominion said. Among those bright spots must be a 8.9% increase in LTL revenue per hundredweight, which was "due primarily to our ongoing efforts to obtain yield increases that offset cost inflation and support our ongoing investments in capacity."
Revenue: 2023 Q3: $1.52 billion vs. 2022 Q3: $1.60 billion
2023 YTD: $4.37 billion vs 2022 YTD: $4.77 billion
Income: 2023 Q3: $445 million vs. 2022 Q3: $496.1 million
2023 YTD: $1.22 billion vs 2022 YTD: $1.41 billion
–
P.A.M. Transport adjusts to new market
P.A.M. Transport (No. 58) had a rough quarter with income collapsing to less than $9 million after Q3 of 2022 saw income at $35.5 million. Throughout all of 2023 so far, the fleet has only chalked up $28 million or so in profit, less than a single quarter of 2023.
Revenue: 2023 Q3: $201.5 million vs. 2022 Q3: $252.6 million
2023 YTD: $630.6 million vs 2022 YTD: $709.2 million
Income: 2023 Q3: $8.8 million vs. 2022 Q3: $35.5 million
2023 YTD: $28.3 million vs 2022 YTD: $95.1 million
–
Schneider National's 'most challenging' phase
Schneider (No. 8) saw revenue down 19% and income down almost 70% in a rough quarter, but said it's gearing up to power it's way out of the "late stages of the current freight cycle" into an "inevitable market recovery."
“Our enterprise experienced year over year declines in revenue and earnings in the third quarter, a period which we believe represents the most challenging phase of this prolonged freight recession,” said Mark Rourke, President and Chief Executive Officer of Schneider. “Our results were driven by ongoing price pressures primarily in our network businesses, as well as other headwinds such as fuel, bad debt, and lower equipment gains.”
Rourke said the fleet is "actively onboarding dedicated business" within the truckload segment, which caused some startup costs.
Revenue: 2023 Q3: $1.35 billion vs. 2022 Q3: $1.68 billion
2023 YTD: $4.13 billion vs. 2022 YTD: $5.04 billion
Income: 2023 Q3: $46.7 million vs. 2022 Q3: $145.5 million
2023 YTD: $268.9 million vs. 2022 YTD: $468.7 million
–
Saia benefits from Yellow's demise
Saia represents one of the few big fleets to grow revenue, with a 6.2% bump and even a tiny .1% increase in income. The fleet saw a 1% rise in operating ratio, but overall held up remarkably well compared to last year.
“I am pleased with how third quarter results came together, especially in light of the significant step-up in volume in late July resulting from the shutdown of a large LTL competitor," said Saia President and CEO, Fritz Holzgrefe. "Our team worked some very long hours to handle a 10% increase in shipments per day compared to June levels while maintaining our high customer service levels. We have added more than 1,000 new employees since the end of the second quarter, and onboarding and training activities are ongoing.”
Revenue: 2023 Q3: $775.1 million vs. 2022 Q3: $729.6 million
2023 YTD: $2.13 billion vs 2022 YTD: $2.14 billion
Income: 2023 Q3: $128.4 million vs. 2022 Q3: $128.4 million
2023 YTD: $347.8 million vs 2022 YTD: $377.7 million
UPS holds out hope for peak season
UPS (No. 2) saw operating profit dive 56.9% in Q3 as revenues fell 12.8%, much like other large fleets on this list.
“While unfavorable macro-economic conditions negatively impacted global demand in the quarter, our U.S. labor contract was fully ratified in early September and volume that diverted during our labor negotiations is starting to return to our network. I want to thank all UPSers for their hard work and efforts during this challenging time and for once again providing industry-leading service to our customers,” said Carol Tomé, UPS chief executive officer. “Looking ahead, we are well-prepared for the peak holiday season.”
Revenue: 2023 Q3: $21.06 billion vs. 2022 Q3: $24.16 billion
2023 YTD: $66.04 billion vs. 2022 YTD: $73.31 billion
Income: 2023 Q3: $1.26 billion vs. 2022 Q3: $3.27 billion
2023 YTD: $6.51 billion vs. 2022 YTD: $9.89 billion
Werner's income cut in half
Werner (No. 13) held on as far as revenue goes, only dropping a single percent, but saw income fully drop 50% amid a challenging market.
“Pricing and margin pressures persist in Logistics, while soft freight demand has reduced overall fleet size in Truckload Transportation Services ('TTS') and we are seeing lower equipment gains," said Derek J. Leathers, Chairman, President and CEO. "Offsetting these impacts and ongoing inflationary headwinds are certain moderating expense categories from our cost saving efforts. Our results continue to reflect a business model that is durable, diversified and resilient despite an extraordinary and extended down cycle. The combination of our talented associates, cycle-tested management team, scale, reputation, and innovation positions us well to navigate, grow and expand margin as the freight market strengthens.”
Revenue: 2023 Q3: $817.7 million vs. 2022 Q3: $827.6 million
2023 YTD: $2.46 billion vs 2022 YTD: $2.43 billion
Income: 2023 Q3: $37.9 million vs. 2022 Q3: $76.3 million
2023 YTD: $138.5 million vs 2022 YTD: $234.7 million
–
XPO stays steady, grows market share
The streamlined XPO (No. 6) grew 1.7% in revenue and 10.8% in income, posting solid results and growing market share while other fleets suffered the bumpy market. Fuel surcharge revenue dipped, but higher tonnage per day and yield pushed them over the line.
“Our third quarter results exceeded expectations, with solid growth in revenue and profitability, and strong forward momentum," said Mario Harik, chief executive officer of XPO. “In North American LTL, we’re improving every aspect of the business that impacts customer service and value creation. Our damage claims ratio was a company-best 0.4% — a significant improvement from 1.2% two years ago, when we launched our LTL 2.0 plan."
“We also captured more share in the quarter, as customers responded to our focus on service and investments in capacity. Our yield growth, excluding fuel, accelerated to 6.4%, reflecting the benefit of numerous pricing initiative," Harik continued.
Revenue: 2023 Q3: $1.98 billion vs. 2022 Q3: $1.95 billion
2023 YTD: $5.8 billion vs 2022 YTD: $5.89 billion
Income: 2023 Q3: $154 million vs. 2022 Q3: $139 million
2023 YTD: $319 million vs 2022 YTD: $373 million


