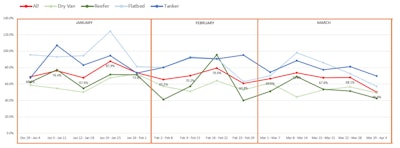
 Click to enlarge graphic. A weekly tracking of driver turnover data by Stay Metrics for the first quarter of 2020 shows a spike before the COVID-19 crisis.
Driver turnover rates spiked early in the first quarter of 2020 before they trended down in March to all-time lows, according to new research by Stay Metrics, which provides driver retention tools for motor carriers.
Historically, turnover has aligned with freight market conditions. When freight volumes rise and capacity tightens, turnover hits higher rates as drivers search for new opportunities. Conversely, they tend to stay put during economic downturns.
The new report by Stay Metrics’ Research and Analytics team led by Bradley Fulton, Ph.D., shows a major shift in the turnover paradigm during the first quarter. Turnover spiked for all truckload sectors before the coronavirus pandemic, but the spike was not necessarily due to positive economic activity.
Freight markets generally were healthy during the first two months. The seasonally adjusted For-Hire Truck Tonnage Index from the American Trucking Associations recorded an increase of 0.1% in January and 1.8% in February.
Before COVID-19, some freight sectors experienced economic disruptions, which could explain the spike in turnover. The new Stay Metrics research report tracks turnover rates on a weekly basis to show how drivers responded to changing market conditions that directly impacted their pay.
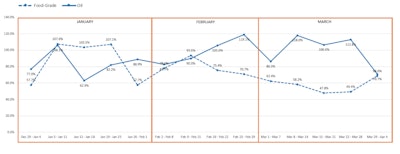
 Click to enlarge graphic. In January, the trendlines of driver turnover diverged for tanker fleets that haul oil or food-grade products.
Key findings in the report are summarized for each freight sector, where “N=” indicates the number of carriers in each dataset. Turnover rates are annualized.
Tanker (N=8) had comparatively higher turnover than other sectors. Rates spiked in the second week of January to 107.1% before the trend lines split for oil and gas haulers and food-grade haulers.
In the third week of January, oil and gas haulers saw a sudden dip from 106.1% to 62.9%. The decline could be explained by the decrease in U.S. oil production that began in January and fell by nearly 7% in February, according to the Energy Information Agency.
Drivers in this sector may have transitioned to food-grade tankers and other industry sectors. In February, the turnover rate for oil and gas haulers jumped from 78% to 119.1% and stayed elevated during the middle three weeks of March (118%, 106.6% and 112.8%) before returning to 68.6% the last week.
By contrast, the turnover rate of food-grade tank haulers increased slightly in early February to 93.6% and fell steadily through March to reach a low of 47.8% before a slight spike at the end of March to 68.6%.
Flatbed (N=18) also had comparatively high turnover. This sector saw a substantial spike in the third week of January from 94.6% to 124.3%, followed by a noticeable dip in the fourth week of February from 91.0% to 62.9%. Rates increased in the second week of March from 70.2% to 98.3% and fell through the end of March to reach 57.2%.
Reefer (N=9) saw a major spike in mid-February. Shipments of food and produce items were stable throughout the health crisis and may explain why drivers in this sector tended to stay with their carriers. By the end of the quarter, turnover reached a low of 42.6%.
Dry van (N=15) also had comparatively low turnover. A substantial spike occurred the third week of February (51.0% to 64.0%) but dropped to 53.0% the next week and held steady through the last week of March.
Tim Hindes, co-founder and chief executive officer for Stay Metrics, cautioned that with driver turnover rates at all-time lows, motor carriers may develop a false sense of security. The culture of their companies has changed dramatically because of limited opportunities to interact with drivers in person, he warned.
 Tim Hindes, CEO of Stay Metrics
“Fleet executives and managers cannot fall asleep at the wheel,” Hindes said. “Now is the time to double-down on retention efforts. Let drivers know they belong to a stable organization that is essential to the economy, and also use this period to rebuild driver-focused cultures.”
Dr. Bradley Fulton, Stay Metrics’ director of research and analytics, concurred with Hindes. “It is important to remember that many things can impact turnover and that not all of them are within a carrier’s control,” Fulton said. “The impact of the coronavirus pandemic is one such factor. Overall carrier culture, however, is something every carrier has the power to influence. Understanding and acting to improve that culture is the best way to positively improve turnover in the long run.”
Stay Metrics provides an online rewards, recognition and engagement platform used by motor carriers to recognize drivers for performance and loyalty. The company also offers survey and analytics products as part of its Stay Ahead platform that includes an onboarding survey program that tracks drivers’ levels of satisfaction during the first year on the job, as well as an in-depth Annual Driver Satisfaction Survey that gives drivers a safe and effective way to provide honest feedback to their carriers.
Stay Metrics recently published an annual Stay Index Report that uses responses from over 15,000 drivers to determine which factors most contribute to their commitment to a carrier, a leading indicator of turnover risk. To download Stay Metrics’ 2020 Stay Index Report, click here.


