Would a map that pinpoints areas where commercial vehicle enforcement is particularly aggressive, along with the targeted trucking regulations, come in handy for a fleet and its drivers?
 Truck inspections per million commercial vehicle miles traveled (Vigillo graphic)
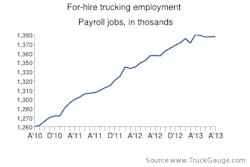
The folks at Vigillo, who provide CSA data services to 2,500 fleets and their 1.2 million drivers, believe so. The State Enforcement Disparity Analysis is the latest product from the IQ Lab, Vigillo’s custom-data unit.
The dataset is not designed to help carriers evade enforcement, but to help them prepare for enforcement that varies greatly from state to state and from lane to lane, Vigillo founder Steve Bryan explained to me after he introduced the package in a Sept. 5 webinar.
The difference, Bryan emphasizes, is “just knowing what to expect.”
CCJ looked at two full years of data from CSA and packaged it to form CSA’s Data Trail, an in-depth look at CSA’s disparities in enforcement and scoring and how they affect carriers. The site features interactive maps, downloadable data and in-depth stories. Click here to see it.
“There is all kinds of discussion and analysis around CSA, encouraging people to focus on those things that are the most predictive of future crashes,” he says. “That’s where the pressure is on the industry. But if enforcement is focusing on other things, then that’s where we’re at a crossroads.”
Simply, in order to protect CSA scores and a carrier’s public reputation, targeted enforcement of the myriad trucking regs leads inevitably to targeted compliance.
“You can’t do everything,” Bryan says. “You’ve got to know what is most critical. That’s what we are trying to do. If you’re working on everything, you’re working on nothing.”
Along with drilling down to the county level in the CSA data, the package features some federal highway stats that the big brains and computer power at IQ Lab used to create tables of commercial vehicle miles traveled (CVMT). Put it all together and, well, it makes my head hurt.
But, as Bryan explains, a little knowledge of spreadsheet workbooks and modern mapping software will go a long way toward helping carrier management make sense of complicated and oftentimes confusing CSA scores. The project’s goal is to simplify and explain the real-world impact of CSA to drivers, terminal-based staff, business partners and, critically, to customers—and to use that understanding to avoid being mischaracterized under CSA’s public scorecard.


A common plea from carriers concerned with their CSA scores, Bryan adds: “How do we explain when we’re struggling? We understand, but we can’t explain.”
So the package includes some sample illustrations, which Bryan highlights in his presentation. Using the CVMT data to “smooth” the inspection results should take away some of the big-state anxiety: Texas and California CV enforcement personnel aren’t necessarily the bullies of highway legend, as aggregate data and driver anecdotes might suggest; they’ve just got big jobs to do with a lot of trucks on a lot of highways. Makes sense.
Except, as Vigillo’s analysis suggests, those big states, in fact, do conduct more inspections, even when the data is “normalized,” that is, divided by CVMT. At the top of the list for inspections/CVMT, however: Montana.
But that’s not all bad. Montana is also the state most likely to issue a clean inspection report (with California not far behind), which is crucial for carriers looking for a little positive reinforcement under the CSA formula. But truckers shouldn’t expect much bonus love from inspectors in Idaho, Louisiana, Oklahoma or Wisconsin, according to the Vigillo math/map.
The lane maps derived from the data are the most interesting part of Bryan’s demonstration. Plugging in a trucking reg and locations along a route returns a connect-the-dot image, with areas of disproportionate enforcement clearly revealed.
 I-5 HOS violations by CSA points (Vigillo graphic)
Oregon’s reputation for being tough on hours-of-service violators? Confirmed. Big time. Indiana and speeding? Don’t drive too fast there, clearly—but, the data shows, the violations are spread uniformly; that is, the major lanes aren’t speed traps, enforcement is just tough all over. Having lamp problems? Get ’em fixed before you hit St. George’s Co., Md. On the other hand, just up the road in Cecil Co., Md., you’d better check your tire tread.
So how’s the data to be used?
“You could ask 10 safety managers how they’re going to approach this and you’ll get 12 different answers,” Bryan says. “The key to CSA’s success is communicating to drivers, getting drivers educated. This is just one more good information source. Now a driver can say, ‘when you’re entering Indiana, slow down.’ Or, on the northern part of I-5 in Oregon, pause and think, ‘do I have my logs in order?’ It’s sharpening the focus.”
Bryan told me IQ Lab has yet to compare the regulatory enforcement maps and CVMT data with truck accident reports, but such an analysis is “high on the list” for study. And that’s where the rubber hits the road for CSA.
For carriers running familiar lanes, much of the enforcement data shouldn’t be a surprise. Still, having a clear picture to show drivers and a simple guide for customers might help until the CSA system gets sorted out.
Until then, I’d certainly like to sit in on any state trucking association meeting where a local enforcement representative tries to explain why the weigh station at mile marker X leads the nation in CSA points for regulation Y—and what that has to do with preventing accidents. Still, I’m an optimist who thinks CSA can work, eventually.
And I’d hope roadside inspectors are all for these maps of hot spots, the way local police put radar locations in the daily newspaper. But that assumes the issue is compliance and safety, not meeting those mythic/mythical CSA violation quotas.