











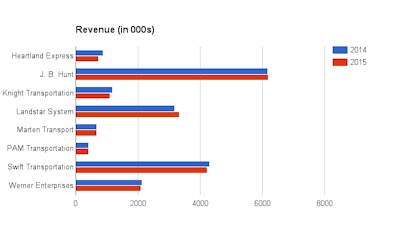
The numbers in the charts below show net income, gross revenue and revenue per tractor for 2015 as reported by some of the major publicly traded truckload carriers. The charts are interactive — hover over the red and blue bars to see the figure for each. To see where the carriers rank in the CCJ Top 250, click here.