CCJ’s Indicators rounds up the latest reports on trucking business indicators on rates, freight, equipment, the economy and more.

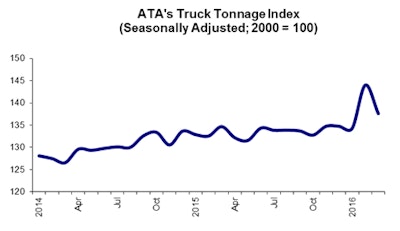
February’s tonnage reading was an all-time high, one of the main the reason for the sizable drop in March, says ATA Chief Economist Bob Costello. “As expected, tonnage came back to earth in March from the jump in February,” he said. “These things tend to correct, and March took back more than half of the surprisingly large gain in February.”
Compared to March 2015, the index was up 2.2 percent. Year to date through March, tonnage is up 3.9 percent from the same period in 2015, ATA notes.
“The freight economy continues to be mixed, with housing and consumer spending generally giving support to tonnage, while new fracking activity and factory output being drags,” Costello says. “In addition, freight volumes are softer than the overall economy because of the current inventory overhang throughout the supply chain.”

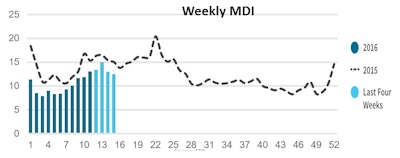
The index measures load availability against truck availability. Rises in load availability put upward pressure on the MDI, while declines put downward pressure on the index. The reverse is true for truck availability: A rise in truck availability would put downward pressure on the index, while a drop would put upward pressure.
The MDI reading this week was 12.5, a reading signaling market favorability for brokers. The 15-20 range signals a neutral market, while anything above 20 signals market favorability for carriers, which would equate to better leverage in rate negotiations.


