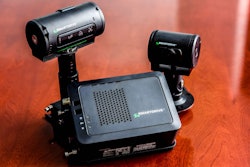
Reporting tools in the SmartIQ Suite from SmartDrive are able to compare fleet performance to industry peer groups.
In January, 2016, SmartDrive Systems gave CCJ a preview of its new Transportation Intelligence Suite (called SmartIQ Suite, for short). With this release, SmartDrive customers gained access to expanded reporting and analytical tools for its video-based driver safety and telematics platform.
The SmartIQ Suite comes with optional “Pro Packs” that leverage Tableau Software for creating interactive visualizations, performance dashboards and “what-if” analysis using SmartDrive data.
On Monday, Oct. 3, SmartDrive announced a new Pro Pack called SmartIQ Segmentation.
The company says this latest addition makes it possible to instantly look across driver and vehicle segments to identify relevant and predictive performance differences, and then to target improvement strategies based on that information.
For example, using SmartIQ Segmentation, a fleet analyst could look at the top risky behaviors in the segments of collision versus non-collision drivers, or the top behaviors for distracted drivers – like smoking or mobile phone use – versus the fleet’s broader driver population. The analyst could also look at segments of drivers based on years of professional driving experience.
The SmartIQ Segmentation report would instantly show the correlation between each of these segments to identify areas of risk and the specific behaviors the fleet needs to target in order to change the outcome.
In Las Vegas on Oct. 3, a demonstration of SmartIQ Segmentation was given to CCJ at the American Trucking Association’s annual MC&E conference by Melissa Purcell, SmartDrive’s vice president of marketing.
She showed an example of how one of SmartDrive’s customers used SmartIQ Segmentation to identify key areas of risk for driver segments based on CDL tenure. The customer looked at these three segments 1) drivers with less than 2 years of experience; 2) drivers with between two and eight years; and 3) those with more than eight years driving experience.
The customer found that drivers in the middle segment had more observable risk events for distraction — like talking on phones and smoking—than the other segments. With that insight, management could target drivers based on their CDL tenure for additional training on distracted driving, she said.


SmartDrive can also leverage its database of 140 million driving events to create segments for analysis. For example, Steve Mitgang, chief executive officer of SmartDrive, says the segment of “collision drivers” have twice as many near collisions, consume over seven percent more fuel and rank higher in every category of distraction compared to “non-collision drivers.”
“Fleets need this information not as an interesting data point, but as actionable insights based on the performance of their own driver population,” he added. “With SmartIQ Segmentation, we’ve put the power in the hands of the fleet to identify new performance patterns and turn that knowledge into personalized action plans that yield measurable improvements in safety, fuel consumption and driver retention.”
SmartIQ Segmentation differs from traditional segmentation approaches that too often rely on historical, demographic or transactional driving data, the company says. Instead, SmartDrive takes an approach that combines verified risk data that comes from video, real-time vehicle data and other historical fleet information to create driver segments that uncover new insights that are delivered in easy-to-understand visual dashboards.
In summary, SmartDrive says its new SmartIQ Segmentation gives fleets the ability to:
- Lower fuel costs by understanding the relationship between specific driver attributes like driving tenure and fuel consumption
- Design bonus and reward programs that can improve multiple performance metrics concurrently
- Reduce turnover by identifying the performance indicators of drivers who leave and those who stay
- Direct management resources to those opportunities likely to have the highest impact and deliver greatest value to the business
- Consolidate data from disparate sources, linking real-time driver performance data with geographic, demographic and other personnel information.
The range of metrics that can be analyzed include:
- Demographic—age, gender, tenure with company and CDL license years
- Behavioral:
- Risk—collision rate, near-collision rates and types, distraction rates and types, SmartIQ Safety Score;
- Driving performance—speeding, close following, unsafe lane departures, U-turns, running a red light, running a stop sign and tampering
- Fuel consumption—overall, city MPG, highway MPG
- Geographic—state, city, zip and GPS location