2016 was by and large a tough year for carriers — one of the toughest in the long and slow recovery since the 2008-2009 recession. Freight was sluggish throughout most of the year, and rates stayed cheap because of it. These trends were reflected in the 2016 earnings reports issued in recent weeks by publicly traded trucking companies. Several of the carriers reported positive financial gains in the year, but more than half recorded drops in revenue, income and other metrics:
Celadon Group
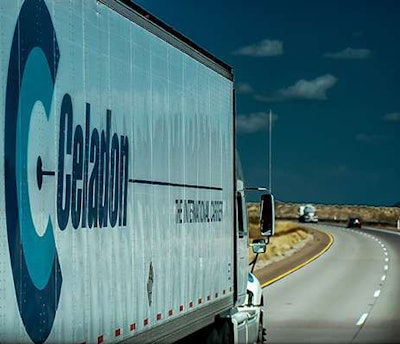
For 2016 fiscal year (July 2015-June 2016)
Gross revenue
2016: $1.065 billion
2015: $900.8 million
EBIDTA
2016: $131.8 million
2015: $141.1 million
Net Income
2016: $24.8 million
2015: $37.2 million
Diluted earnings per share
2016: 91 cents/share
2015: $1.52/share
Covenant Transportation Group
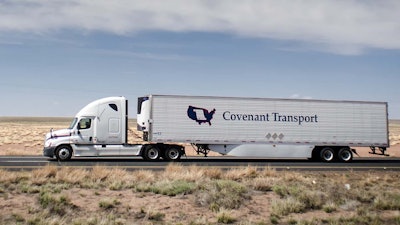
For 2016 calendar year
Gross revenue
2016: $670.7 million
2015: $724.2 million
EBIDTA
2016: $104.9 million
2015: $125.7 million
Net Income
2016: $16.8 million
2015: $42.1 million
Diluted earnings per share
2016: 92 cents/share
2015: $1.93/share
Heartland Express
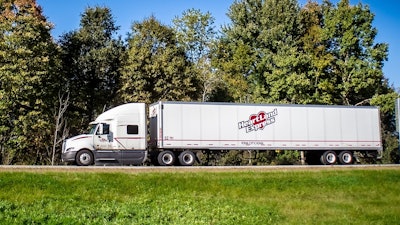
For 2016 calendar year
Gross revenue
2016: $612.9 million
2015: $763.3 million
EBIDTA
2016: $191.1 million
2015: $227.6 million
Net Income
2016: $56.4 million
2015: $73.1 million
Diluted earnings per share
2016: 68 cents/share
2015: 84 cents/share
J.B. Hunt Transport
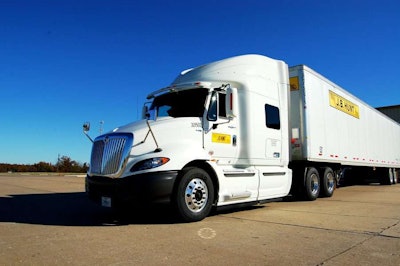
For 2016 calendar year
Gross revenue
2016: $6.56 billion
2015: $6.19 billion
EBIDTA
2016: $1.07 billion
2015: $1.06 billion
Net Income
2016: $432.9 million
2015: $427.2 million
Diluted earnings per share
2016: $3.73/share
2015: $3.66/share
Knight Transportation

For 2016 calendar year
Gross revenue
2016: $1.12 billion
2015: $1.18 billion
EBIDTA
2016: $267.1 million
2015: $$296.2 million
Net Income
2016: $93.9 million
2015: $116.7 million
Diluted earnings per share
2016: $1.17/share
2015: $1.47/share
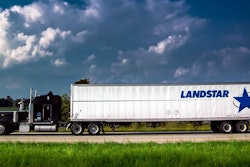
Landstar System
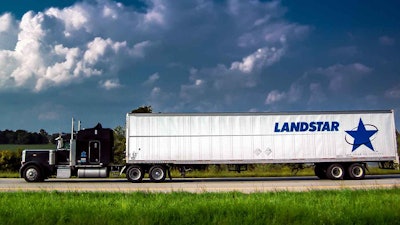
For 2016 calendar year
Gross revenue
2016: $3.17 billion
2015: $3.32 billion
EBIDTA
2016: $259 million
2015: $270.8 million
Net Income
2016: $137.3 million
2015: $147.7 million
Diluted earnings per share
2016: $3.25/share
2015: $3.37/share
Marten Transport
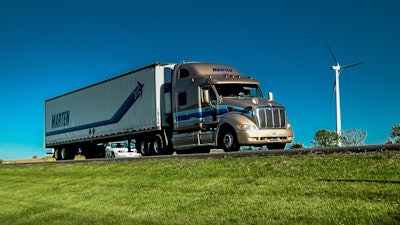
For 2016 calendar year
Gross revenue
2016: $671.1 million
2015: $665 million
EBIDTA
2016: $140.7 million
2015: $132.2 million
Net Income
2016: $33.5 million
2015: $35.7 million
Diluted earnings per share
2016: $1.02/share
2015: 99 cents/share
P.A.M. Transportation Services
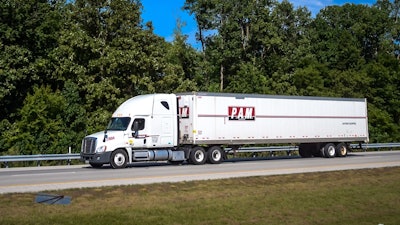
For 2016 calendar year
Gross revenue
2016: $430.2 million
2015: $417.1 million
EBIDTA
2016: $60.7 million
2015: $68.6 million
Net Income
2016: $11.5 million
2015: $21.4 million
Diluted earnings per share
2016: $1.75/share
2015: $2.93/share
Swift Transportation
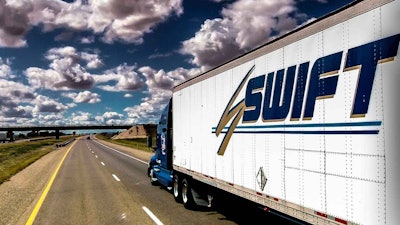
For 2016 calendar year
Gross revenue
2016: $4.03 billion
2015: $4.23 billion
EBIDTA
2016: $535.3 million
2015: $640.1 million
Net Income
2016: $149.3 million
2015: $197.6 million
Diluted earnings per share
2016: $1.22/share
2015: $1.49/share
USA Truck
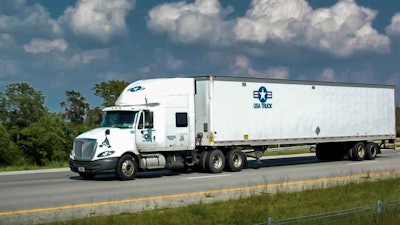
For 2016 calendar year
Gross revenue
2016: $434.2 million
2015: $507.9 million
EBIDTA
2016: $33.8 million
2015: $63.3 million
Net Income (loss)
2016: (3.9 million)
2015: $11.1 million
Diluted earnings per share
2016: (4 cents)/share
2015: $1.27/share
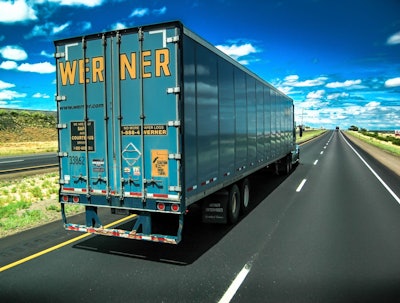
Werner Enterprises
For 2016 calendar year:
Gross revenue
2016: $2.01 billion
2015: $2.09 billion
EBIDTA
2016: $335.8 million
2015: $393.7 million
Net Income
2016: $79.1 million
2015: $123.7 million
Diluted earnings per share
2016: $1.20/share
2015: $1.09/share


