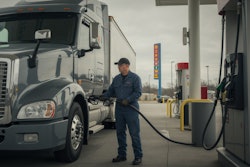
With trucking economic indicators pointing toward record-tight capacity and record-high rates, carriers were able to capitalize in the first half of 2018, according to earnings reports from the country’s largest publicly traded carriers.
Of the nine carriers highlighted below, all saw their revenue and profits climb significantly from the same time period — Jan. 1 to June 30 — in 2017. Publicly traded companies Schneider National and U.S. Xpress have not yet released their earnings reports for the second quarter. I’ll follow up with their numbers when they’re released this week.
Here’s a look at carriers’ top line numbers, denoted by revenue (which includes fuel surcharge), and their bottom-line profits, listed as income. These numbers are for the first six months of 2018, compared to the months in 2017. The same publicly traded carriers have mostly seen strong revenue and income growth since the third quarter of last year.
—
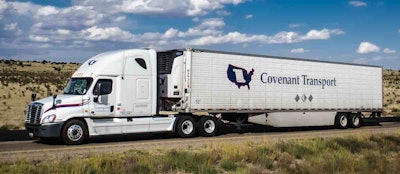
Covenant Transportation
Revenue
2018: $369.9 million
2017: $323.1 million
Income
2018: $14.4 million
2017: $1.5 million
Diluted earnings per share
2018: 54 cents
2017: 8 cents
—
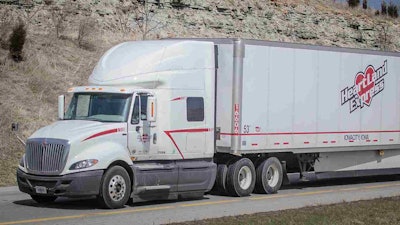
Heartland Express
Revenue
2018: $312.5 million
2017: $259.5 million
Income
2018: $31.2 million
2017: $28.7 million
Diluted earnings per share
2018: 38 cents
2017: 34 cents
—
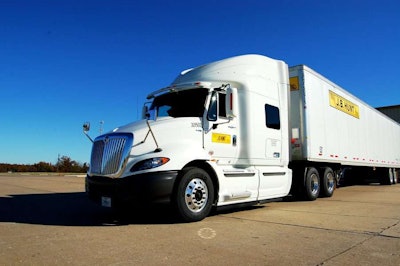
J.B. Hunt
Revenue
2018: $4.09 billion
2017: $3.36 billion
Income
2018: $266.8 million*
2017: $200.6 million*
Diluted earnings per share
2018: $2.44
2017: $1.80
*reported as net earnings
—
Knight-Swift Transportation
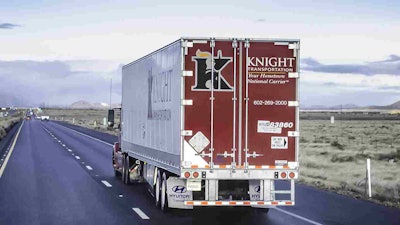
Revenue
2018: $2.6 billion
2017: $544.4 million
Income
2018: $162.4 million
2017: $33.4 million
Diluted earnings per share
2018: 90 cents
2017: 40 cents
Notes on Knight-Swift: The companies merged last year in September, meaning there’s no prior first quarter to measure them against.
—
Landstar Systems
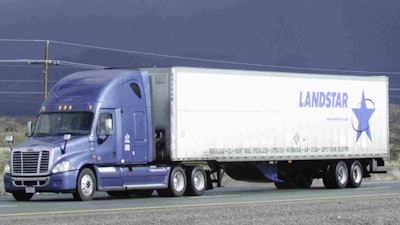
Revenue
2018: $2.07 billion
2017: $1.54 billion
Income
2018: $120 million
2017: $69.9 million
Diluted earnings per share
2018: $2.87
2017: $1.66
—
Marten Transport
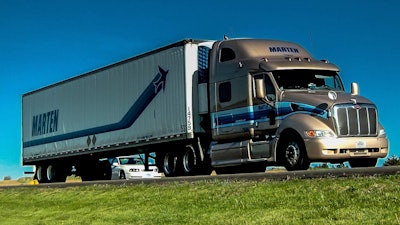
Revenue
2018: $384 million
2017: $344.7 million
Income
2018: $24 million
2017: $17.4 million
Diluted earnings per share
2018: 44 cents
2017: 32 cents
—
P.A.M. Transport
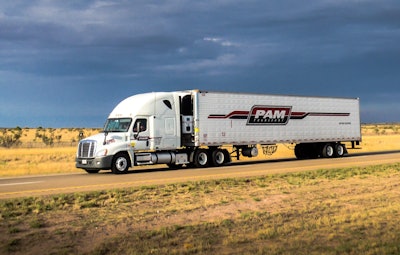
Revenue
2018: $254.8 million
2017: $218.05 million
Income
2018: $8.7 million
2017: $3.9 million
Diluted earnings per share
2018: $1.39
2017: 61 cents
—
USA Truck
Revenue
2018: $260.4 million
2017: $209 million
Income
2018: $3.6 million
2017: (7.7 million)*
Diluted earnings per share
2018: 44 cents
2017: (96 cents)*
*loss
—
Werner Enterprises
Revenue
2018: $1.18 billion
2017: $1.02 billion
Income
2018: $66.07 million
2017: $39.2 million
Diluted earnings per share
2018: 99 cents
2017: 54 cents


