Damon Langley had been working in local transportation for three years before taking a job at J.B. Hunt in 1993, and after just a few months in the customer service department, Johnnie Bryan Hunt stopped by to offer some advice: “Son, just remember this: Once you book a load, you’ve made all the money you are going to make.”
 An expert advises using metrics for fleet profitability that account for time-based activities in the network.
Langley turned this simple expression over in his mind, convinced it must have a deep and profound meaning, but as he took on new roles in brokerage and planning its meaning became more clear.
Network design and management, he said, is the top of the hierarchy for fleet profitability.
“It is not just about getting the highest rate. It’s not just about where or when I send the truck. It’s not just about the customer I choose to do business with,” said Langley, a Trimble Transportation Consultant. “It’s all these things working together that lead to attaining the most revenue over time within the strategy of the business.”
Langley presented a breakout session, “Measurements You Can Actually Manage,” during the 2020 Trimble In.sight conference, held Aug. 24-26. The ambition for the breakout, he said, was to provide attendees with “an end-to-end view of your business using key performance indicators (KPIs) by functional area to measure results and discover opportunities for improvement.”
Increasing Freight Velocity
Langley explained how KPIs can help people determine, at a glance, how efficiently and effectively they are executing against a company’s goals. To do this, KPIs must be specific, measurable, timely, relevant and job-centric.
Langley urged leaders to choose the right metrics and inform people why the chosen metrics matter. Using a standard metric such as “miles per truck per week” gives people a sense of direction, over time, as to whether or not a company is attaining a goal but doesn’t really get to the “why.” People also need to be informed of how they contribute to the goal, he said, and the measures that provide nuance around the “why” are the key to continuous improvement.
Langley discussed common factors to include in KPIs that account for the quality of revenue, such as “rate per mile” and “rate per total mile,” to reveal added costs and inefficiencies like out-of-route and deadhead miles.
But, he said, “If I only consider rate, I may choose shippers that will waste my time, or go to markets where I don’t have enough freight, which also wastes time. All these things mean less revenue over time.”
Loads with lower rates but higher velocity can generate more margin than loads that offer higher rates but waste time.
To illustrate, he provided this example: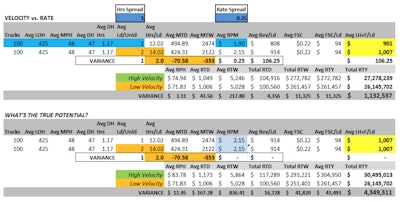
He also called out small increments of wasted time that are massive when annualized, such as not having loads available when needed, poor trailer management, inflexible or bad appointments and slow planning. For example, 100 trucks wasting 15 minutes equals 25 hours a day, and if you want to average $70/hour that’s $1,750/day.
Working 5.5 days a week, 52 weeks a year, the fleet would lose $500,500 a year in revenue opportunity. With multiple causes of small increments like this the number grows rapidly.
“By measuring these issues by functional area, you can begin to recapture some of these losses,” he said.
Velocity was a common thread in the KPIs that Langley covered for the different functional areas of a company. All functional areas should contribute to improve velocity in terms of revenue, time, cost, freight flows and balance, according to Langley. He said there is an inextricable link between velocity and retention, because velocity allows drivers to make more money from driving – to the tune of thousands of dollars per year – while also improving revenue. More importantly, it enables drivers to make a more consistent paycheck, leading to greater job satisfaction.
Langley discussed several functional areas and gave recommendations for which KPI to use for each. For example:
- Drivers execute on the trip plans given to them, and some KPIs to hold them accountable are “miles per week,” “pay per week as a percentage of revenue per week” and “driving percentage versus on-duty percentage,” which provides insights into potential versus actual productivity.
- Customers should be measured based on revenue quality, quantity and operational efficiency with KPIs such as “revenue per hour from Arrive-at-Shipper to Depart-Final.”
- Customer Service Reps (CSRs) solicit freight within the network. He suggested using “revenue per hour” as a basis for finding loads that increase revenue and velocity.
- Load Planners are responsible for maximizing driver miles, and minimizing deadhead and dwell time. Langley recommended using “revenue per total planned transit time,” among others.
- Driver Managers (DMs) are the link between the customer and the driver. To help DMs give load planners better information, Langley recommended using technology to automate and perpetually update estimated arrival time (ETA) and projected time available (PTAs).
Seeing the big picture
Langley concluded the session with an overview of Trimble Transportation’s Reveal business intelligence platform as a way to capitalize on data by giving people in all functional areas real-time KPIs and decision support tools.
Reveal integrates with products in the Trimble family as well as with other internal and external data sources to take data in, cleanse it, consolidate and rationalize it, “so you can see the big picture,” he said.
The platform is offered as a monthly subscription and includes the data warehouse, calculations, visualizations and standard content.
As a best practice, Langley discussed Microsoft’s Power BI as the reporting template for companies that use an on-premise approach. Power BI comes with a turnkey library of 27 data visualizations. For a hosted BI solution, he talked about Domo. It comes with double the number of data visualizations, more data connectors and unlimited cloud storage.


