Fleets cite prolonged freight recession and capacity oversupply, and while LTL carriers show more resilience, operating ratios for truckload carriers deteriorated in the most recent fiscal quarter. There’s a focus on structural cost reduction among many carriers, while insurance and claim costs continue to be a significant headwind. Some carriers also note optimism about market tightening from regulatory enforcement and a rise in carrier exits.
Covenant navigates muted demand
Overcapacity and muted demand remain headwinds for Covenant Logistics (CCJ Top 250, No. 36). Its asset-light business units were essentially flat year-over-year, and truckload business units reported weaker performance, with Chairman and CEO David Parker noting that it’s shifting capital toward its “better returning business units.” Utilization remains a concern. Truckload's freight revenue grew by 1.0% due to a 4.6% increase in the average tractor fleet but was partially offset by lower equipment utilization. The Expedited segment decreased its average total tractors by 3.4%, while average freight revenue per tractor per week was down 5.0% because of a 5.4% decline in utilization. The Dedicated segment’s average tractor count increased by 9.7%, while average freight revenue per tractor per week was up 1% due to an increase in freight revenue per total mile. This was also partially offset by a 5.7% decrease in utilization.
The company’s 49% equity investment in Transport Enterprise Leasing is also being affected by rising bankruptcies from the past 12 months, bringing down its earnings. It noted potential headwinds on hiring and retaining skilled drivers, additional insurance premiums brought on by nuclear verdicts settlements, and equipment-related expenses.
Revenue: 2025 Q3: $296.9 million vs. 2024 Q3: $287.9 million
2025 YTD: $869 million vs. 2024 YTD: $762 million
Income: 2025 Q3: $9 million vs. 2024 Q3: $13 million
2025 YTD: $25 million vs. 2024 YTD: $29 million
Forward Air says sale of company still in progress
Earlier this year, Forward Air’s board launched a formal strategic review after investors raised concerns about the company’s 2024 merger with Omni Logistics.

Forward Air (No. 41) CEO Shawn Stewart said in a recent call with analysts that a “strategic alternative review process” is still underway with potential interested parties. Stewart said the company continues to focus on cost structure optimization, with CFO Jamie Pierson adding that ongoing cost-cutting efforts have generated roughly $12 million in annualized savings. The company is also laying the foundation for its One Ground Network, which combines its U.S. and Canadian business operations for linehaul, pickup and delivery, brokerage, and expedited services, under a single structure.
Revenue: 2025 Q3: $631.8 million vs. 2024 Q3: $656 million
2025 YTD: $1.86 billion vs. 2024 YTD: $1.84 billion
Income: 2025 Q3: $15 million vs. 2024 Q3: $22.7 million
2025 YTD: $39 million vs. 2024 YTD: $(1.13) billion
Heartland Express reports another loss
Heartland Express (No. 28) reported a net loss of $8.3 million, which CEO Mike Gerdin said was driven by overcapacity, weak freight demand, and freight rates amid rising operating costs. Insurance and claims were the biggest chunk among its expenses (from $11 million in the same quarter last year to $15 million). The company is continuing its strategy of “disposing of excess trailers within our fleet as used market conditions improve.” The average age of its tractor fleet was 2.6 years as of September 30, 2025, compared to 2.7 years a year ago. The average age of its trailer fleet was 7.5 years, compared to 7.2 years on the same period last year.
Revenue: 2025 Q3: $196.5 million vs. 2024 Q3: $259.9 million
2025 YTD: $626 million vs. 2024 YTD: $805 million
Income: 2025 Q3: $(8.2) million vs. 2024 Q3: $(9.2) million
2025 YTD: $(33) million vs. 2024 YTD: $(28) million
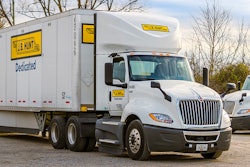
J.B. Hunt sees results from its cost reduction efforts
While revenue was flat year over year for J.B. Hunt Transport (No. 5), operating income was up 8%. CEO Shelley Simpson said that improved performance was driven by operational excellence, cost reduction efforts, and network execution. Intermodal showed solid performance as it sought to prioritize “network balancing” during bid season. Though transcontinental loads were down 6%, it was offset by a 6% increase in Eastern loads. The Dedicated segment also showed improvement, with a 2% increase in revenue, driven by a 3% improvement in productivity.
Final mile services and integrated capacity solutions segments remain challenged by demand softness. Truckload segment saw its load growth increase, but declining revenue per load and higher equipment and insurance claims expense are impacting income.
Revenue: 2025 Q3: $3.05 million vs. 2024 Q3: $3.06 million
2025 YTD: $8.902 billion vs. 2024 YTD: $8.940 billion
Income: 2025 Q3: $170 million vs. 2024 Q3: $152 million
2025 YTD: $417 million vs. 2024 YTD: $415 million
Knight-Swift shows mixed signals
Knight-Swift Transportation Holdings (No. 3) reported a modest revenue increase, but trade name impairments and higher insurance and claims costs impacted operating income. The LTL segment showed strong growth with a 21.5% year-over-year revenue increase, with shipments per day up 14.2%. The Truckload segment saw a 2.1% revenue decline year over year, with a 2.3% decrease in loaded miles. CEO Adam Miller also noted the early impacts of regulatory enforcement on capacity, “which we believe may have an outsized impact on the lowest price capacity in the one-way, over-the-road market.” In its truckload segment, the average age of the tractor fleet was 2.7 years, compared to 2.6 years in the same quarter of 2024. The LTL segment’s average age of the tractor fleet was 3.9 years and 4.2 years in the same quarter in 2024.
Revenue: 2025 Q3: $1.92 billion vs. 2024 Q3: $1.87 billion
2025 YTD: $5.6 billion vs. 2024 YTD: $5.5 billion
Income: 2025 Q3: $7.86 million vs. 2024 Q3: $30 million
2025 YTD: $72.7 million vs. 2024 YTD: $48 million
Landstar invests in AI products
Landstar (No. 11) reported revenue was essentially flat, and operating income fell sharply in the quarter. It also saw its first sequential growth in its independent business owner (BCO) truck count since Q1 2022. Insurance and claim costs also increased to $33 million, up from $30.4 million in Q3 2024. President and CEO Frank Lonegro also noted that regulatory enforcement of English Language Proficiency and non-domiciled CDL holders could impact capacity gradually. CFO James Todd also added the company’s plans to implement AI-powered customer service solutions and other AI-enabled products to help employees.
Revenue: 2025 Q3: $1.20 billion vs. 2024 Q3: $1.21 billion
2025 YTD: $3.56 billion vs. 2024 YTD: $3.60 billion
Income: 2025 Q3: $19.3 million vs. 2024 Q3: $50 million
2025 YTD: $91 million vs. 2024 YTD: $149.7 million
Marten’s dedicated business shows strength
Marten Transport (No. 40) reported a drop in revenue and operating income. Its operating ratio also worsened, from 98.2% last quarter, to 98.8% in Q3 2025. Chairman and CEO Randolph Marten noted pressure from weak demand, oversupply, inflationary costs, reduced freight rates, and network disruptions. The company also completed the sale of assets related to its intermodal business to Hub Group, Inc. for approximately $51.8 million in cash. Although revenue declined in its dedicated business segment slightly, its average revenue per tractor increased modestly ($3,776 million vs. $3,693 million prior year) in Q3. As of September 30, 2025, the carrier had a total of 2,823 tractors, compared to 3,080 tractors on September 30, 2024. The average age of tractors was 2.2 years, compared to 1.8 years in the same period last year. Total trailers were 5,165 trailers, while in the same period last year, it was 5,456 trailers. The average age of trailers was 4.9 years in this quarter and in the same quarter a year ago.
Revenue: 2025 Q3: $220 million vs. 2024 Q3: $237 million
2025 YTD: $673 million vs. 2024 YTD: $733 million
Income: 2025 Q3: $2.2 million vs. 2024 Q3: $3.7 million
2025 YTD: $13 million vs. 2024 YTD: $21 million
Old Dominion sees LTL shipments drop
Old Dominion Freight Line (No. 9) reported revenue was down 4.3%, which President and CEO Marty Freeman noted was due to a 9% drop in LTL tons per day. Freeman noted headwinds such as a downturn in the economy, inflation, cost increases, equipment availability, and regulatory changes. Freeman also highlighted yield improvements as revenue per hundredweight was up 4.7% and high service metrics (99% on-time service and cargo claims ratio of 0.1%) during the quarter.
Revenue: 2025 Q3: $1.406 billion vs. 2024 Q3: $1.470 billion
2025 YTD: $4.1 billion vs. 2024 YTD: $4.4 billion
Income: 2025 Q3: $270 million vs. 2024 Q3: $308 million
2025 YTD: $794 million vs. 2024 YTD: $922 million
P.A.M. reports net loss
P.A.M. Transportation Services (No. 55) reported a net loss and a 17.7% year-over-year revenue decline. The Truckload segment saw a significant drop in miles and loads, indicating soft demand, along with an operating ratio of 106.7% (compared to 100.5% in the previous quarter in 2024). The company also noted an increasing cost base, such as increasing wage, benefit, and equipment depreciation.
Revenue: 2025 Q3: $150 million vs. 2024 Q3: $182 million
2025 YTD: $456.7 million vs. 2024 YTD: $548 million
Income: 2025 Q3: $(5.5) million vs. 2024 Q3: $2.4 million
2025 YTD: $(23) million vs. 2024 YTD: $(217,000)
Schneider National shows resilient in revenue growth
Despite industry headwinds, Schneider (No. 6) saw growth in revenues, including a 17% increase in the Truckload segment. The Truckload segment saw strength in the company’s dedicated business, primarily due to the acquisition of Cowan systems. Dedicated average truck count also grew 28% year over year. Intermodal revenue also saw an increase of 6%, while Logistics revenues were up 6% compared to the same quarter in 2024.
Revenue: 2025 Q3: $1.4 billion vs. 2024 Q3: $1.3 billion
2025 YTD: $4.2 billion vs. 2024 YTD: $3.9 billion
Income: 2025 Q3: $19.4 million vs. 2024 Q3: $30.6 million
2025 YTD: $81.5 million vs. 2024 YTD: $84.4 million
Saia holds up well in tough market
Saia (No. 18) saw its revenue flat year over year, while LTL shipments and tonnage per workday decreased, although LTL revenue per shipment increased. President and CEO Fritz Holzgrefe noted, “I was pleased with our team's ability to focus on what was within our control throughout the quarter. We remain intently focused on the customer, while at the same time maintaining cost management and improving core execution." The company continues to invest in technology and network optimization efforts, Holzgrefe said.
Revenue: 2025 Q3: $839.6 million vs. 2024 Q3: $842 million
2025 YTD: $2.44 billion vs. 2024 YTD: $2.420 billion
Income: 2025 Q3: $86 million vs. 2024 Q3: $92.7 million
2025 YTD: $207.5 million vs. 2024 YTD: $285.9 million
Werner shows mixed results
Werner Enterprises (No. 14) saw a 3% revenue bump, though it posted an operating loss of $13 million, compared to $17.6 million in the prior year. Due to a challenging market, the company noted it saw mixed results across segments. Logistics saw significant growth in revenue, while the Dedicated segment’s revenue grew due to its new fleets. One-way truckload's revenue per total mile rose for the fifth consecutive quarter but reduced miles per truck and saw operating costs impacting margins.
Revenue: 2025 Q3: $771 million vs. 2024 Q3: $745.7 million
2025 YTD: $2.23 billion vs. 2024 YTD: $2.27 billion
Income: 2025 Q3: $(20) million vs. 2024 Q3: $6.5 million
2025 YTD: $13 million vs. 2024 YTD: $22 million
XPO’s LTL business indicates strength
XPO (No. 10) saw its revenue rise, with its LTL segment reporting strong performance. CEO Mario Harik stated, “In North American LTL, we grew adjusted operating income by 10% to $217 million and improved our adjusted operating ratio by 150 basis points to 82.7%, significantly outperforming seasonality.” Harik cited results to efficiency, network upgrades, and AI-driven productivity improvements. Harik added, “Our intense execution is resulting in record service quality and margin expansion at the trough of the cycle. We’re in the early innings of realizing our long-term margin opportunity, and we expect performance to accelerate as our strategy continues to gain traction.”
Revenue: 2025 Q3: $2.11 billion vs. 2024 Q3: $2.05 billion
2025 YTD: $6.14 billion vs. 2024 YTD: $6.15 billion
Income: 2025 Q3: $82 million vs. 2024 Q3: $95 million
2025 YTD: $257 million vs. 2024 YTD: $312 million