CCJ Innovators profiles carriers and fleets that have found innovative ways to overcome trucking’s challenges. If you know a carrier that has displayed innovation, contact CCJ Editor Jeff Crissey at [email protected] or 800-633-5953.
In 2010, motor carriers were adapting to the new Compliance Safety Accountability program and its scoring methodology that weighted hours-of-service violations more heavily. Like many fleets, Heniff Transportation began looking at electronic logs.

In early 2013 when Heniff operated 250 trucks, it completed its fleetwide implementation of e-logs. During the process, drivers voiced concerns about using them. “What’s in it for me?” was a common sentiment, says Joe Neal, director of information technology for the liquid bulk chemical hauler.
In response, Heniff rolled out a new driver incentive and scorecard program that “turned that whole [e-log] process into a huge positive for drivers,” says Justin Neal, director of business integration.
For the first version of the incentive program, fuel efficiency was the primary focus. “We wanted (the program) to pay for itself,” he says.
The fuel efficiency metrics for the driver scorecard were pulled from the PeopleNet mobility system in Heniff’s tractors. Drivers who met the company’s performance target received a monthly bonus of up to $400.
 Drivers at Heniff Transportation receive a daily message in the PeopleNet system with their scorecard details.
Heniff later added key performance metrics from multiple data sources using Microsoft SQL Server Reporting Services. With this business intelligence tool, the company created dashboard-style reports with tabs and drill-down features to view information on each driver at the event level.
In 2016, Heniff made further investments in BI technology to obtain real-time analytics and more robust data visualization capabilities. The Tableau platform became a central part of its BI toolkit.
“With all the new technology, the data is easier to get to than ever before,” says Justin Neal. “It’s been a long road for us with a lot of evolutions.”

As the driver scorecard evolved, Heniff also created a scorecard and incentive program for driver managers. Holding managers accountable for driver performance and rewarding success “took us to the next level,” he says. “A huge push for us was getting everybody engaged.”
The Freight Portal
Heniff recently developed its Freight Portal that gives customers full transparency of orders from initial tender to final delivery. The portal updates the locations of orders and ETAs every five minutes by using data from both tractor- and trailer-tracking systems.
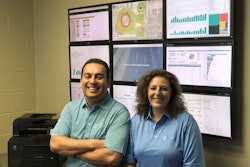
 Joe Neal (left), director of information technology for Heniff Transportation, and Justin Neal, director of business integration, oversaw the company’s driver incentive and scorecard program that led to another scorecard for managers and its Freight Portal that provides shipment transparency to customers.
Rather than login to the website to track the status of shipments, the company’s shipper customers can enter an email or mobile number to receive notifications and alerts to track the progress of their orders. Shippers also can give their own customers, the consignees, access to Heniff’s Freight Portal for real-time order visibility.
“We want our customers to gain business by using this,” Joe Neal says.
The company began developing the Freight Portal two years ago by cleansing and scrubbing the data in its customer files, such as locations of shipping and receiving facilities, to ensure accuracy.
Once this step was complete, Heniff developed an integration between its transportation management software system from TMW Systems and a custom freight visualization platform from 10-4 Systems; the integration became the Freight Portal.
Heniff recently completed a beta test of the Freight Portal with several customers, who now can see the real-time ETAs and status of all their orders on a single screen in a control tower view.
“With all this data, our thought process for the Freight Portal was to make it a one-stop shop for our customers,” Joe Neal says. “We want everything to be transparent, in real time, and we want our customers to utilize it.”
Heniff can add links to the Freight Portal to give customers custom Tableau reports. These highly visual and interactive reports show key performance indicators such as load counts by origin and destination, demurrage by location, freight spend, accessorial charges and anything else the customer requests.
The information in the reports is live, and its customers can refresh the information at the click of a button. With real-time visibility of ETAs, detention times and key metrics in the Freight Portal, Heniff now is able to engage its customers in “full partnership” to “improve business processes and results,” Joe Neal says.
Customers also can view documents for each order, such as bills of lading and scale tickets. The Freight Portal updates these images online immediately after drivers capture scanned documents using an app on their phones.
Heniff is working to include HOS information in the real-time ETA information it shares with customers. Shipment ETAs will account for required rest breaks, weather and traffic for down-to-the-minute accuracy.
A predictive scorecard
Since initially rolling out its driver scorecard, Heniff has continued to add new data sources and metrics that are predictive indicators of driver safety, fleet maintenance and other areas.

One scorecard metric comes from the fleet’s SpeedGauge application and shows the points drivers earn for complying with posted speed limits.
The most recent metric shows drivers the number of points they have earned for using the Tire Pass service at Love’s Travel Stops. This metric was added to the scorecard after management discovered that tire failures caused by low air pressure were the company’s top cause of breakdowns, Joe Neal says.
As drivers pull into fuel lanes at Love’s facilities that offer Tire Pass, a tire technician inflates their tires to the proper pressure, records tread depth and inspects lights and other items. The inspection data is sent to Heniff’s maintenance software system.
By using its BI tools, Heniff validates that Tire Pass lanes were available and open for service at the locations where drivers fueled. This process ensures that the scorecard’s Tire Pass metric accurately reflects if drivers used the service wherever and whenever it was available.
Every day, drivers see the details of their score through a message sent to the PeopleNet Tablet display in the cab. The message shows drivers the bonus they are on track to receive each month.
The bonus is scaled by mileage and starts at $175 per month with a maximum payout of $500. Drivers who obtain a monthly score of 90 or above out of 100 receive the full bonus amount. About 75 percent of Heniff’s drivers qualify for the full bonus every month, Justin Neal says.
Seeing the results
Since Heniff started the scorecard and incentive plan, the company has doubled in size to 500 trucks. The biggest savings are from fuel economy, which has increased by 20 percent since starting the program.
Justin Neal says the metrics show savings from the scorecard and bonus program are six times the expense of driver bonuses. “It is a program that really pays for itself,” he says.
Driver retention has proven to be another benefit. The data show turnover rates of more than 50 percent for drivers who are not getting the bonus. The turnover rate for drivers getting the bonus is less than 20 percent.
The company also has seen “huge improvements” on the safety side, and Heniff’s CSA scores are among the industry’s best, Joe Neal says. The fleet also has seen big increases in revenue and asset utilization. “A lot of things are working the right way,” he says.
Heniff also has received an increase in business from customers who have beta-tested its Freight Portal, a trend Joe Neal expects will continue as more of them are introduced to the technology.
“Six months from now will be totally different in terms of how many users we have on (the Freight Portal),” he says. “It’s an exciting time for us right now.”
Note: Joe Neal and Justin Neal will be speaking about the above topics at the CCJ Solutions Summit in November in a session titled “Business Intelligence and Profitability.” Click here to register for the CCJ Solutions Summit.