November retail up over 2010
U.S. retail and food service sales in November were 0.2% higher than October and 6.7% higher than November 2010 on a seasonally adjusted basis, according to advance estimates from the U.S. Census Bureau. Sales by nonstore retailers outpaced the overall growth, rising 13.9% year over year. The strongest increase in sales from October to November was at electronics and appliance stores, where sales were up 2.1%. Total sales for September through November were up 7.4% from the same period last year.
Manufacturing orders surge
ISM’s New Orders index for the manufacturing sector was 56.7% in November, a jump of 4.3 points from the October level. November was the second straight month for growth after several months of mild contraction. The improvement suggests an increase in near-term shipments.
Truck loadings up slightly in November
(Seasonally Adjusted: 2000=100)
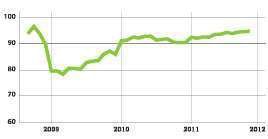
SOURCE: FTR ASSOCIATES

For more data, forecasts and trends as well as daily alerts and weekly summaries, subscribe to TruckGauge at www.truckgauge.com.
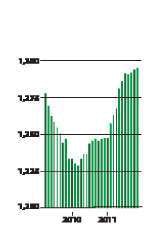
Trucking adds jobs in November
Better days ahead
About 56% of the participants in Randall-Reilly’s monthly MarketPulse survey expect that business conditions – adjusting for seasonality – will be better in six months than they were in November. And only 2.2% believe conditions will be worse.
SAME — 42%
BETTER — 53%
WORSE — 2%
MUCH BETTER — 3%


