Shippers, freight brokers and carriers all play a role in setting the rates in the freight market. But this year has seen more volatility than years past, with a possibility of the underlying conditions, such as COVID-19, continuing for several more years.
In this environment, carriers that do not know and understand their costs and how they behave are likely to do stupid things from a pricing standpoint to try to increase their revenues.
 Robert Sullivan is the CEO of Transportation Profitability Group, which provides a costing and operations productivity software package in conjunction with profit improvement consulting services for the carrier industry.
Motor carriers have two different tactics to immediately impact their bottom line. The first is to raise prices. A price increase drops straight to the bottom line because there is no increase in cost. This tactic will be difficult in this environment.
The other is to become more productive and efficient in operations. Like a price increase, a cost reduction drops straight to the bottom line. Becoming more productive and efficient is the best option to improve profitability and is within your control.
Driving profitability
In a previous CCJ article, I explained how a key profitability metric works for LTL and truckload carriers: variable cost as a percent of revenue.
The two early warning signals for a decline in this profitability metric are:
- An increase in variable cost as a percent of revenue.
- A drop in contribution dollars per shipment.
In this article we will delve further into a business concept called cost, volume, contribution.
If variable cost as a percent of revenue is increasing, so is the variable cost per shipment. If both are increasing, then contribution margin and contribution dollars per shipment are decreasing. Likewise, revenue per shipment may also be decreasing.
What you want to avoid is to have both revenue and contribution dollars per shipment going in the wrong direction.
If contribution dollars per shipment (or load) goes down, you must handle more shipments to generate the same contribution dollars to cover your fixed and semi-fixed costs. Not understanding this or having the ability to control these two variables is what drives carriers to “chase expenses with more revenue.”
It becomes a vicious cycle that has never worked and never will.


The leverage ratio
My previous article in CCJ explained how carriers should calculate their breakeven point for revenue in terms of contribution margin percent. To review:
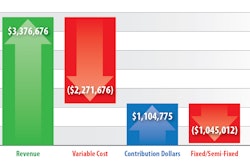
- Variable cost is the expense to operate fleet assets.
- Contribution dollars is revenue minus variable cost. It is the money left over after covering variable cost to cover fixed and semi-fixed costs.
- Contribution margin percent is contribution dollars divided by revenue.
- Variable cost as a percent of revenue is variable cost divided by revenue.
In that article we showed how just a 1% increase in variable cost increases the breakeven point (i.e. contribution margin percent) between 4% and 9%.
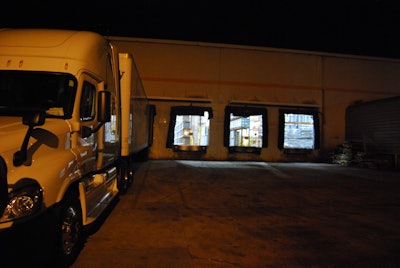
 In a tough market, LTL carriers should focus on the efficiency and productivity of their P&D and dock operations, which are areas they have nearly total daily control over, Sullivan says.
Let’s use a real-life example. In a six-month period an LTL carrier allowed its variable cost as a percent of revenue to increase by 1%. The company’s fixed and semi-fixed cost per day was $34,708; contribution dollars per shipment was $39.80; and revenue per shipment was $121.54.
Given those numbers the carrier needed to handle 872 shipments a day just to break even.
In that six-month period, its variable cost as a percent of revenue increased by 1% (not a good trend), and contribution dollars per shipment dropped by 3.1% to reach $38.59, or $1.21 per shipment.
The LTL carrier saw its breakeven point for shipments per day increase by 27 to reach 899.
Meanwhile, the carrier’s percentage above breakeven dropped from 34.64% down to 30.53%. The difference of 4.11% represents the increase of its breakeven point. Do you see our leverage principle at work? The 1% increase in variable cost increased its breakeven point by 4.11%.
What this shows is that small changes in variable cost produce large changes in profitability either up or down.
Focusing on productivity
In a challenging environment, your best line of defense is to improve productivity. This cannot be done by focusing on traditional metrics like bills per hour, wages as a percent of revenue and stops per hour. How you measure productivity must be more relevant and granular.
Where do you start? For LTL carriers, between 96 and 97% of their total variable costs are concentrated in three areas: pickup and delivery (P&D), dock/platform and linehaul operations. Linehaul costs are difficult to control on a day to day basis due to service commitments. However, they do have nearly total daily control of P&D and dock cost/productivity.
Focusing on the productivity of P&D and dock operations will be the quickest way to decrease your breakeven point. If variable cost per shipment goes down, contribution dollars per shipment will go up.
In summary, your key metrics in this battle are breakeven point, variable cost as a percent of revenue, and contribution dollars per shipment.
Together these metrics form the cost, volume, contribution formula. Companies who use this formula will find that the quickest and surest way to arrest the negative impact on profitability from a challenging environment is to improve productivity.
Robert Sullivan is the CEO of Transportation Profitability Group, which provides a costing and operations productivity software package in conjunction with profit improvement consulting services for the carrier industry.


![Reintroducing The Mack Anthem Rebuilt For Regional Haul[79]](https://img.ccjdigital.com/mindful/rr/workspaces/default/uploads/2026/07/reintroducing-the-mack-anthem-rebuilt-for-regional-haul79.FdrR1gEDrK.jpg?auto=format%2Ccompress&fit=crop&h=400&q=70&w=600)