During the April to May bust cycle in the freight market, plenty of motor carriers wondered if freight brokers were thriving at their expense.
The Owner-Operator Independent Drivers Association, a trade group for independent contractors and small carriers, seemed to think so. The group, among others, petitioned the Federal Motor Carrier Safety Administration to require more transparency of freight broker transaction costs and essentially margins.
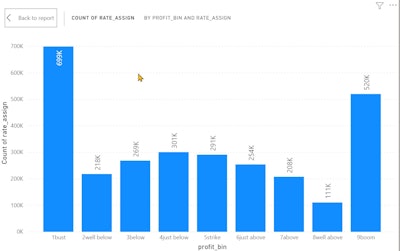
 This chart shows the transaction set Wilson analyzed using the strike scoring algorithm. The count of transactions in the bust category is greater than the count of transactions in the boom category.
Title 49 of the Code of Federal Regulations (49 CFR), section 371.3, already requires freight brokers to keep records of transactions, and subpart (c) gives any party to a transaction, including a motor carrier, the right to review those records.
OOIDA wants FMCSA to make subpart (c) a mandate for automatic disclosure.
The Transportation Intermediaries Association (TIA), which represents brokers and third party logistics (3PL) firms, wants FMCSA to strike subpart (c) from the regulation entirely. TIA points to a 1995 act by Congress that terminated the Interstate Commerce Commission (ICC). The act gave shippers, carriers and brokers the ability to require in contracts that one party or another waive their review rights in subpart (c).
Many 3PLs also have non-disclosure agreements with shippers when it comes to freight rates, and require waivers from motor carriers as a condition for doing business.
Getting more transparency of rates and margins no longer depends on both parties following the regulations, however. Motor carriers and 3PLs have access to market rate data from many sources.
“The very thing [OOIDA and TIA] are arguing over — net margin spreads — is more transparent than ever in the history of trucking,” said Criss Wilson, a data scientist for McLeod Software, which develops enterprise software systems for asset and non-asset transportation providers.
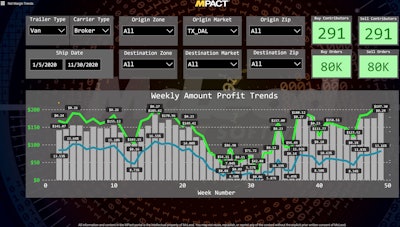
 This chart shows the average net profit margin, profit per mile, and buy rate, by week, for shipments originating in Dallas, Texas. Profit margins for brokers (as a percentage) were in the low single digits during the summer months. Click to enlarge.
As a data scientist with a background in transportation, Wilson has analyzed freight transactions in 2020 using new algorithms and business intelligence tools. He has discovered that perhaps contrary to popular belief, 2020 for brokers has been more of a bust than a boom.
Getting a new perspective
Wilson has developed new analytical tools for MPact, a free business intelligence service for customers of McLeod Software, that aggregates rate data from more than 1,000 freight brokers and motor carriers that use the company’s PowerBroker and LoadMaster enterprise software systems.
“All of the analytics we are creating don’t exist by any of the rate makers now,” he said. “We want carriers and brokers to be better negotiators.”
One of the new tools is called a rate spectrum. It has a visualization, a gauge, that shows the “rate curve” for any lane origin and destination pair. The minimum buy rate (the money paid to the carrier) is on the left-hand side of the gauge and the maximum on the right. The arc of the gauge has quartiles that show the spread of the buy rates for each lane.
The needle of the gauge points to the average buy rate. The spot where it lands on the quartiles indicates where pressure is moving rates — up or down, he explains.
Wilson developed another tool he calls a “strike” algorithm that scores the net margins of lanes. In Texas fashion, he describes the strike zone as the crosshairs of a rifle scope where brokered loads have a profit margin of between 14% and 16% of the gross revenue.
Brokers miss their mark whenever transactions have net margins lower than this. The strike algorithm slots freight transactions into bins of net profit margin. The profit bins go up and down from the strike zone in increments of three percentage points. The top bin is set at a margin of 25% or above and the bottom at 5% or below.
When analyzing 2020 data, Wilson expected to see a normal distribution, or curve, for the net profit margins for freight transactions. A normal distribution would peak in the strike zone. What he saw instead was an abnormal curve that had peaks on both ends of the spectrum.
“It blew my mind when I saw the results,” Wilson said.
Offsetting losses
Based on an analysis of more than 3 million freight transactions in 2020, most brokers average margins were below 15%. The number of transactions in the middle range of the strike zone were nominal. If brokers were taking advantage of the market then the curve would be shifted to the right, but any big wins they had appeared to be necessary to offset their losses, he said.
The only period that brokers averaged above 15% net profit margins in 2020 was from week 14 in early April through week 20, but the higher-than-normal margins did not last. When brokers are making more than 15% they are in danger of being undercut, he said.
The reason broker margins tanked after week 20 was not due to undercutting, however. Supply chains were in disarray and assets were out of position. Brokers were taking losses on a significant percentage of loads to get capacity to markets where it was needed.
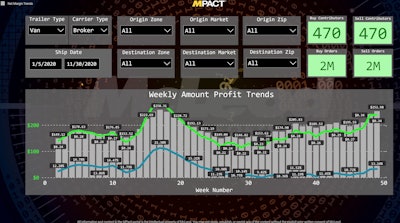
 This chart shows the average net profit margin by week for all van shipments in the dataset. Click to enlarge
With so many transactions in the “bust” zone, brokers had to offset them with big wins just to stay afloat. Wilson describes the role of 3PLs as providing fluidity in the market by absorbing the risks of buying and selling between shippers and carriers. Without this arbitrage, “trucks would not be moving,” he said.
After week 20, net margins went down to around 10% and stayed there. In dollars, the average margin during this period was about $200 per transaction. Having worked at a 3PL, Wilson knows an average spread of $200 is a recipe to go out of business. His theory is that brokers used their extra profits from weeks 14 through 20 to cover losses in later weeks.
Brokers were likely trying to hold contract rates for their customers after week 20, which added pressure to their margins. The data show that rate increases have been rolling through in the last 9 weeks, which has helped to normalize net margins at 13 to 16% with average rates now at $2.44 a mile.
The extra money brokers have been making in the last nine weeks has already been spent, he said, to cover loads they booked earlier and paid for using bank credit lines.
“I can tell you that brokers are not taking advantage of asset carriers. It is quite the opposite,” he said. “In this market, based on what we know of the buy-sell spread, asset providers have got to be earning some righteous profit margins.”
Wilson said the data analysis also shows the average length of haul has increased for brokers and carriers. “It is high and will remain high,” he said. “There aren’t enough trucks to go around.”
Rates for carriers and margins for brokers are likely to remain higher than average until supply and demand normalize, which it always does. “The market will always seek equilibrium,” he said.


