Shippers continue to pay a premium for transportation amid pandemic-related supply chain disruptions. According to DAT, truckload rates hit new highs and freight volumes remained elevated in July but rates slid from June’s record levels.
The DAT Truckload Volume Index, an aggregated measure of dry van, reefer and flatbed loads moved by truckload carriers, was 222 last month – down 8% compared to June. A baseline of 100 reflects freight volume in January 2015.
“Shippers not only experienced escalating spot and contract rates in July, they were hampered by port congestion, unloading delays, shortages of trucks and drivers and more recently tighter intermodal capacity,” said Ken Adamo, DAT chief of analytics. “With holiday merchandise already arriving at ports, for many shippers there is more freight than the commercial transportation system has the capacity to handle efficiently. All modes are under stress.”
Spot van, reefer rates hit new highs
The national average spot rate for van loads on the DAT One load board network was $2.73 per mile, up 5 cents from June and 70 cents higher year-over-year (all rates include a fuel surcharge). The July average is 28 cents higher than November 2020, when holiday freight volume was peaking.
The national average spot reefer rate rose 4 cents to $3.14 per mile, a new all-time high. The reefer rate has increased from June to July only once (in 2020) since DAT established the Index in 2010. Since 2015, the average spot reefer rate has fallen an average of 6 cents from June to July.
The national average spot flatbed rate fell 3 cents last month to $3.12 per mile, in line with seasonal expectations.
Rates have continued to leak slightly throughout the month of August.
According to Truckstop.com, rates for the week ending August 20 dropped 1 cent compared to the week prior to $2.91 per mile. Van rates increased 3 cents to $2.66 and reefer rated increased 5 cent to $3.33. Flatbed rates dropped 4 cents to $2.90.
Total spot rates continued their slide since setting an all-time high in late May, according to Truckstop.com and FTR, but lower flatbed rates offset gains in dry van and refrigerated. Total rates have been down in nine of the last 12 weeks, and the gain in one of those weeks was a fraction of a cent. However, the period between June and the holidays is traditionally weak, so rates are keeping pace or better with seasonal expectations. Rates were surging in the van markets at this point in 2020, and dry van rates potentially could go negative year over year within a few weeks if they soften from current levels. However, barring a collapse, refrigerated rates should stay positive year over year at least until Thanksgiving and perhaps well beyond. Flatbed rates could go negative year over year by November if they were to continue their steady slide from the mid-May record.
Contract rates set records
Contract truckload rates again set records for all three equipment types, reflecting urgency among shippers to secure capacity and reduce volatility in their supply chains.
The average contract rate for dry vans was $2.79 per mile, up 6 cents compared to June while the average reefer rate increased 2 cents to $2.90 per mile. The contract flatbed rate jumped 17 cents to $3.29 per mile.
Spot load postings fell
With contract rates at all-time highs, the number of loads posted to the DAT One load board network fell last month 17.1% compared to June, while the number of trucks declined 6.6%. Van and reefer load-to-truck ratios increased month-over-month. The national average van ratio was 5.8, meaning there were 5.8 available loads for every available van on the DAT network, up from 5.6 in June. The reefer ratio was 12.6, up from 11.6, while the flatbed ratio fell from 66.8 in June to 44.3 last month.
Data from Truckstop.com and FTR Transportation Intelligence for the week ending August 20 shows that spot volume continues to move slightly stronger than seasonal expectations. To-date there's no signs that a resurgence of the pandemic has hurt volume or rates. Total load postings rose 3.2% as the key segments of dry van, refrigerated, and flatbed each increased for the first time in a month. Volume in the latest week was about 41% above the same week last year and about 172% above the five-year average (2015-2019). Dry van continues to be mostly stable. While flatbed volume was about 47% below its all-time high in mid-May, refrigerated load postings were the highest since the spike in early May related to the International Roadcheck inspection event.
With an increase in load postings and decline in truck postings on Truckstop.com, the Market Demand Index rose to 145.0, which is the strongest level in about a month. However, refrigerated recorded its second-highest MDI ever as the dry van MDI is mostly stable, and the flatbed MDI generally has been settling.

Truck tonnage slides
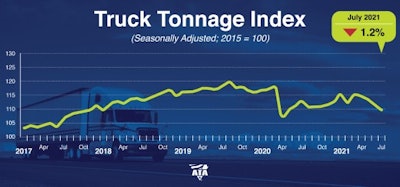
American Trucking Associations’ advanced seasonally adjusted (SA) For-Hire Truck Tonnage Index decreased 1.2% in July after falling 2% in June. In July, the index equaled 109.8 (2015=100) compared with 111.1 in June.
ATA Chief Economist Bob Costello said softness in tonnage over the last few months is due more to supply constraints, rather than a big drop in freight volumes.
“Not only are there broader supply chain issues, like semiconductors, holding tonnage back, but there are also industry specific difficulties, including the driver shortage and lack of equipment," he said. "For-hire truckload carriers are operating fewer trucks than a year earlier. It is difficult to haul significantly more freight with fewer trucks and drivers.“ In addition to these supply issues, retail sales and housing starts, both large drivers of truck freight, retreated in July, although both rose on a year-over-year basis."
Compared with July 2020, the SA index fell 2.9%, which was the first year-over-year drop since March. In June, the index was flat from a year earlier. Year-to-date, compared with the same seven months in 2020, tonnage is down 0.2%.The not seasonally adjusted index, which represents the change in tonnage actually hauled by the fleets before any seasonal adjustment, equaled 111.9 in July, 3.2% below the June level (115.6). In calculating the index, 100 represents 2015. ATA’s For-Hire Truck Tonnage Index is dominated by contract freight as opposed to spot market freight.
August outlook
West Coast port markets are driving demand for truckload services as ships continue to bunch up outside the ports of Long Beach and Los Angeles, where about one-third of all container imports arrive, according to DAT.
The average outbound spot van rate from Los Angeles was $3.70 per mile at the beginning of August, up roughly 2% during July. Los Angeles to Phoenix, a key warehouse and distribution market for retailers, averaged $4.61 a mile during the first week of August, $1.88 higher than the national average for spot dry van freight.
The ongoing chassis trailer shortage has been exacerbated by higher-than-normal dwell times for local container delivery and intermodal railcars to move containers from West Coast ports to inland destinations. Shippers are turning to the spot market for capacity: the number of dry van loads moved from Los Angeles to Chicago soared nearly 40% over a four-week period starting July 3.


