“Opinions differ.” That’s a great phrase by Patrick Swayze from the movie Road House. A great example of this happens every year when meteorologists start predicting the paths of hurricanes. There are so many models with different predictions that when plotted out on a map they call them spaghetti charts. This is a classic case of George Box’s observation — paraphrased as — “all models are wrong, some are useful.”
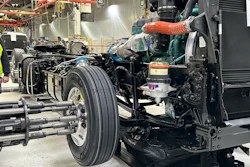
In February, NACFE invited groups from across the spectrum to analyze the Run On Less – Messy Middle data. The run was completed in September 2025. It captured 18 days of telematics and operational data from 13 fleets operating 14 heavy-duty Class 8 tractors from eight different OEMs and powered variously by diesel engines, natural gas engines, battery electric powertrains, and hydrogen fuel cells. The fuels included diesel, renewable diesel, bio-diesel, renewable natural gas, natural gas, electricity and hydrogen.
Twenty-seven groups accepted the challenge and met in Boulder, Colo., over a day and half whirlwind session where each participant had 15 minutes to present and five to answer questions. The audience included representatives of eight fleets, members of NACFE and RMI, and representatives of the 27 groups. The event was framed as a “potluck” where each attendee had to bring their own dish in order to partake. To encourage open discussion, the event strictly followed Chatham House Rule so that nothing said or presented would be attributed to any person or group. More than 55 people participated.
I’ve spent a career trying to understand differences between analyses. Why different methods produce different results. Why 10 different reputable models produce 10 different results. I summarized my experience in the SAE report Fuel and Freight Efficiency – Past, Present and Future Perspectives and in my first report for NACFE Determining Efficiency. The NACFE data workshop potluck shed a new spotlight on many of the reasons.
The starting point of all analysis, all models, is data. NACFE’s Run On Less data originates from the trucks themselves — on-board telematics systems transmitting vehicle parameters. That raw data is treated as the proverbial, sacrosanct one source of truth. But it’s not the whole story. That data is an approximation of the real world. The truck itself does not know everything about itself, and software is constantly making assumptions based on a limited set of sensors and metrics.


A simple example is estimating speed on the speedometer. The truck has to assume a diameter of the tire — actual tires do not keep the same diameter as they wear, and loaded tire diameter depends greatly on tire pressures and the weight of the vehicle, all of which vary. But doesn’t GPS data provide more exact speeds? Well, yes and no. GPS data is not being recorded every fraction of a second. There is a sampling rate that can vary from fractions of second to minutes in length. Software algorithms and data collection are just approximating the speed.
That on-board truck data gets sent to a data aggregator. It often has holes, moments where data dropped out, or spurious signals were received. Several years ago, I analyzed a truck and the fuel gauge showed an increase in fuel over the trip. Stuff happens in the real world; equipment is not perfect. Data collection is not continuous.
An aggregator takes that problematic raw data and turns into something that appears continuous and consistent. Sometimes that aggregation occurs by multiple parties in series. The original raw data may have been tuned for consumption by analysts, often through proprietary methods unknown to the final user.
Other data, like weather, temperature and road grade, may come from sources other than the truck. Weather and temperature conditions often come from local airport data, often miles from the actual route the truck is taking. Accurate road data has gotten much better over the years, but again is not necessarily perfect.
Analysis of the provided data opens up a whole world for differing interpretations. All models have built in assumptions and simplifications. Models approximate the real world because the real world is pretty complicated. Assumptions are made to be able to simplify that complexity so that a result can be obtained and discussed. Sometimes biases are built into these. An example is using national averages for the cost of energy for one vehicle while comparing that to using regional energy prices for another, effectively biasing the results.
Sometimes these assumptions are needed just to fill the absence of better detail. One continuous issue NACFE encounters is not knowing the weight of freight or even the tare weight of the truck and trailer. Yes, there are ways to estimate that, but getting definitive, measured freight weights requires running the trucks across weigh scales, or adding weighing systems on-board trailers.
Algorithms can estimate the weights from powertrain performance factors, but I emphasize these are estimates only, and the quality and accuracy of that data is perennially problematic. Tolerances on the numbers can be plus or minus thousands of pounds. Tare weights, you would think, are readily available, but they are not. For numbers to be truly accurate, we need to know the weight of the human driver, how much liquid is on board, how much stuff the driver has in the truck, are there load locks, chains, or other extra equipment being carried, etc.
Fuel costs are particularly challenging to estimate. There are reliable sources for national averages. But your truck is driven by you on a specific road in Texas. Your fleet has negotiated a fuel price. There may also be a surcharge added. All that differs by location.
Speeds are notoriously abused in analyses. For example, compare a truck driving in Texas to one in California. Seems simple, right? The legal max speed for trucks in California is 55 mph. Texas has roads at 55, 60, 65, 70, 75 and 80 mph in many places. Under hours of service, 11-hours of driving at 55 mph means 605 miles. Eleven hours at 75 mph is 825 miles. The maximum range depends a lot on local speed limits, traffic congestion, time of day, weather, etc. This gets even more complicated because trucks can be equipped with speed limiters, and a fleet or OEM may not allow the truck to go its maximum speed.
Comparisons of daily ranges also often neglect detention time and out of route mile considerations that differ between vehicles. They rarely include discussion of dead-heading and repositioning trucks in non-revenue generating driving. They rarely consider time of day congestion factors that differ significantly by region. Sometimes they ignore that vehicles are parked a lot of their day, irrespective of powertrain.
Freight weight is major challenge for disconnects in analysis. All too often analysists assume every truck operates at its legal max weight. While this is an easy assumption it is horribly inaccurate, with the majority of trucks often operating well below their maximum weights. Yes, some fleets, particularly bulk haulers, max out their weight on out bound trips, but they also drive back empty. Fifty percent of miles are not a maximum weight. That is not a small amount.
Then there are assumptions about what the trailer is. Tractors currently have no idea what trailer they are pulling. It could be any of many lengths, it could be doubles and even triples. Comparing a truck hauling a single 28’ trailer to one hauling triples introduces significant differences, points that may be missed or assumed irrelevant in some analyses. Industry experts came to the conclusion years ago that freight ton efficiency expressed in freight ton miles per gallon was probably the best metric for comparing vehicle performance in hauling freight. I bet that gauge is not on your truck’s dashboard.
For me, the NACFE data workshop highlighted that everyone can see things differently. They are not wrong. Making assumptions is inherent in modeling. All are likely value added and diverse opinions are critical to making informed decisions.
I offer up an alternative to George Box’s sage advice adjusted for Patrick Swayze’s: All models are different. Most are useful.