Many of soccer's World Cup host cities are poorly prepared for the traffic gridlock expected during this summer's soccer tournament, according to Geotab.
Analyzing billions of data points from commercial vehicles in June and July 2025, the study assessed how road networks in all 16 host cities handle sudden spikes in traffic. The evaluation measured everyday congestion, engine idling times, driver safety and city "resilience" — how well local infrastructure bounced back during past major concerts and sporting events.
The findings present a bleak outlook just three weeks before the tournament begins. Ten of the 16 host cities scored below 7 out of 10 on Geotab's preparedness scale. Foxborough, Massachusetts, a Boston suburb, was the sole city to score above an 8, earning an 8.01.
Conversely, Los Angeles, Vancouver and Toronto landed at the bottom of the rankings, all scoring under 5 out of 10. Both Los Angeles and Atlanta struggled severely with resilience, scoring below 1 out of 10 after failing to absorb large crowds without major traffic disruptions in the summer of 2025.
"The world’s most popular sport is coming to cities across North America, putting the infrastructure of many cities through the ultimate pressure test this summer," Mike Branch, Geotab's vice president of data and analytics, said in a statement. "The challenge is moving people, goods and services during massive events."
A companion survey of 3,000 motorists across the United States, Canada and Mexico revealed widespread driver anxiety. Traffic stress spikes sharply on event days for 89% of drivers in Mexico, 79% in the U.S. and 76% in Canada.
Fuel waste from gridlock is another major financial concern for residents. Fuel anxiety was highest in Mexico, where 83% of drivers expressed worry over idling costs, followed by 76% in the U.S. and 67% in Canada.
Geotab’s rankings weighed traffic conditions immediately surrounding the tournament stadiums at 60%, while the remaining 40% factored in the wider metropolitan area. The company plans to track and publish traffic updates throughout the duration of the tournament.


Contents of this video
00:00 10-44 intro; How the World Cup Will Impact Trucking & Freight
01:00 Geotab Data: How Cities Are Being Ranked
01:45 The 4 Factors: Congestion, Emissions, Safety & Resilience
04:15 The BEST Cities for World Cup Traffic
05:47 The WORST Cities for World Cup Traffic
07:27 Driver Survey: Stress, Safety, and Fuel Economy Concerns
08:53 Fleet Takeaways: How to Optimize Routes This Summer
Speaker 1:
The FIFA World Cup is coming to North America this summer, which of the 16 host cities is best equipped to handle the increased traffic.
Speaker 2:
Hey everybody, welcome back. I'm Jason Cannon and my co-host is Matt Cole. 16 cities across the United States, Canada, and Mexico will host one of the biggest sporting events in the world this summer, the FIFA World Cup Soccer Tournament. The event begins June the 11th and goes through July the 19th.
Speaker 1:
So why does that matter to trucking? Put simply traffic. While all of the host cities and stadiums are used to handling sporting events and concerts, the magnitude of the World Cup could put even more stress on the infrastructure around the venues. Geotab has analyzed the data to rank the cities by how they should be able to handle the influx of people.
Speaker 3:
So what we were really looking at is that there's a huge series of games that are about to descend upon North America and we really wanted to understand the impact to freight in our commercial vehicle movement. Oftentimes people look for data to figure out how resilient are their cities going to be when certain games and matches or events hit. And oftentimes people don't even know that the data exists to be able to support them. So part of the goal here was to kind of highlight this for cities to help them understand that there's data that can support them in making some of these difficult decisions around what's going to happen when that next event hits their city. What's going to happen whenever there's some construction that happens in a specific area of the city? How do freight networks adapt? And so this data is uniquely positioned for that.
Speaker 2:
To compile its rankings, Geotab looked at a handful of data points from its customer base to determine how the 16 host cities might fare this summer.
Speaker 3:
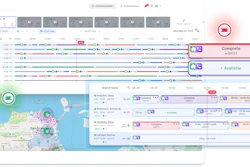
We look at data at scale. So we're working with over six million connected vehicles across the globe. Vast majority in Canada and the United States. And we're collecting over a hundred billion data points per day across the ecosystem. And so this is across over 100,000 customers globally. And so the data that we're looking at is all privacy compliant. We've built an incredible altitude platform which takes this data and provides insights for cities to make when it comes to things like traffic planning and freight analysis. And so what we did here is we looked at a methodology that took a few things into account. And the first kind of factor that we looked at was one that is not surprisingly a big thing of importance for cities is congestion. Simply how is the traffic moving according to the speeds that have been set up? So traffic, you have certain speed limit signs that are put in place in metropolitan areas and we're looking at that kind of free flow movement.
So how well is the traffic moving against regulate speed limits? Plus number one is congestion. That we put the biggest weight on because in our work with our altitude platform, a lot of these municipalities, congestion is the number one that they look for. Number two and is a bit of a factor when it comes to congestion as well too is idling and emissions. So we weighed that at about 15%. Safety is another factor that we came to play. So how many times are we seeing harsh braking and hard acceleration events within the frame? The last factor I think for us was really the most interesting one because this one framed the resilience of the city. It's recovery time. So while you might have a city that is very congested, how quickly did it come back to that kind of same level of congestion? So that resilience score was the final score.
And what we did is we looked at for major events in the past. So it might have been, I don't know, a Taylor Swift concert or a large sporting event. How did the city recover? Both within the five kilometer radius of that specific stadium and then also more broadly within, we did another 20 kilometer circle around that. So we looked at both the immediate vicinity of the stadium and then more largely. So those four factors came to play when we were looking at the score and that's how we've come to play with what we've got today.
Speaker 1:
So which of the 16 host cities is expected to be able to handle the various World Cup events the best?
Speaker 3:
At the top of the list was Gillette Stadium just outside of Boston there in Foxboroug. And I think the thing, and this was a general theme that we saw across the board. Typically, if your stadium was situated a little outside of the downtown core, you tended to fare pretty well. So it had a very good congestion score. Also had a very good resilience score. So that meant that it was able to recover very quickly. So either it saw very little change to its congestion pattern or it was able to kind of bounce back very quickly. So really impressed by what we saw with Gillette Stadium there. NRG Stadium in Houston also fared quite well. The on kind of caveat there is you never know what's going to happen with weather pattern events and knock on wood, there's no big weather event that happens in around the Houston area, but that could of course change things.
The on that was quite surprising in the top three was Asteca Stadium in Mexico City there. That was very surprising to me because I've driven in Mexico before and I know what congestions. So while it does not look so good on the congestion score, its resilience score was very well. So what that means is that yes, it might well have been. It's a very congested city, but it's able to cope with some of these larger events better than some of the other cities that we're seeing. So you will still hit congested traffic, but the resilience of the city to be able to cope with that level of traffic in a normal way is quite good.
Speaker 2:
Now exactly where is going to have the hardest time handling this influx of people and traffic?
Speaker 3:
At the bottom of the list we've got Toronto, my hometown and we've got Vancouver and LA. And so the prime reason that we're seeing for Toronto being at the bottom is not only it's very congested like a lot of the other cities here, but the thing that really brought the score down was resilience. So not only is it a congested city and the stadium sits just on the outside of the city, not in the suburbs, but on the outside of the city. And it's along one of the core freight areas within the city. So that Gardner Expressway is consistently jammed. And then what ended up happening is that resilience score is what brought it down. And that really was a function of how well the city was able to recover to its normal rates. So it took a while for it to bounce back to a normal congestion and that's what set it at the bottom of the list.
Vancouver was really only at the bottom of the list due to the safety element of the score. And I don't want to call it saying that it's not a safe city or that the streets aren't safe. If you look at the way that Vancouver is constructed, there's a huge grid, signal controlled grid and there's a lot of forced breaking and acceleration events. So we think that that's part of the reason what we're seeing there. So invariably it's nothing the driver can control sometimes. There's a lot of start-stop events that happen there. And then LA was third from the bottom there. Again, a very congested city, but similar to Toronto, that resilience score wasn't there. It was not able to really cope with large events in a strong way.
Speaker 1:
Geotab also asked drivers about their expectations for the upcoming event and the vast majority are expecting things to be a whole lot more stressful. There
Speaker 3:
Were a couple of things there that surprised me as well too. So not surprisingly, on average about 79% of our customers, we've pulled over I think 3,000 drivers across Canada, United States and Mexico, and about 79% of them said that it's more stressful during some of these large events, which is not really a surprise. You're stuck in traffic, you're worried about getting to your customers. You can't take the train. There's no means for you to do that. And so it's difficult for these drivers. And a lot of them are concerned about safety whilst on the road too. That was another, I think it was about 75% on average are concerned about the safety of the roads. There's more pedestrians on the streets and all this kind of thing. The thing for me that was the most interesting was the concern that the drivers had even during these busy times, these events for fuel consumption and making it to their customers on timers.
About 65% raised that as a strong concern. And so it just goes to show you that it's not just about getting to and from a customer. It's not just about being safe on the road, but they're also concerned about the fuel economy, especially in the world that we live in today. So these are some of the things that were popping up and certainly rightly to be concerned, there's a lot that's descending upon these 16 cities during this time.
Speaker 2:
So what should fleets take away from these rankings?
Speaker 3:
What I would look at on the scoring of the cities is, look, you're a driver driving in a city, you know certain cities are congested no matter what. What I would do is have a look at the resilience score that we've created here because that will give you a sense of how well the city is able to cope with that influx of demand for some of these events. Those that have a higher resilience score that are already well congested, you're just going to see the norm, what you see every day. Those that have a high congestion score but a very low resilience score, that's where you certainly want to make sure you give yourself some extra time for today, make sure that you look at routing and optimization solutions to help you plan for the day and certainly there's added stress. But I think that resilience score is really the one I'd keep an eye out for on this list.
Speaker 2:
That's it for this week's 10:44. You can read more on ccJdigital.com while you're there, sign up for our newsletter and stay up to date on the latest in trucking industry news and trends. If you have any questions or feedback, please let us know in the comments below. Don't forget to subscribe and hit the bell for notifications so you can catch us again next week.