CCJ‘s Indicators rounds up the latest reports on trucking business indicators on rates, freight, equipment, the economy and more.

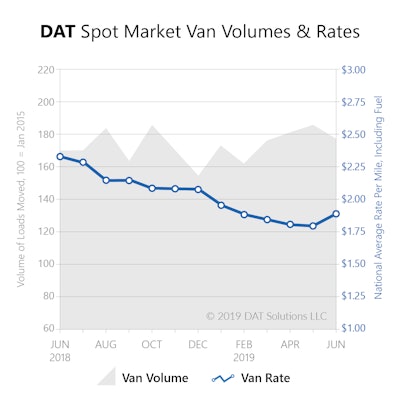
The uptick in rates was due to more constrained capacity in June, says Peggy Dorf, a DAT analyst. “The annual Roadcheck inspection blitz limited truck availability in the first week of the month,” she said. “The urgency to move shipments before the close of Q2 sustained those price increases through the end of the month.”
Spot market van freight volume was 4.4 percent higher in June 2019 than in June 2018, according to the DAT Truckload Volume Index, which reflects the change in the actual number of loads moved each month. Compared to the first six months of 2018, van volume was 7 percent higher in the first half of 2019.
Despite these gains, the DAT Truckload Volume Index showed a 5 percent decline from May to June, a common trend in recent years.
Reefer volume fell from May to June for the third year in a row, as agricultural producers continue to grapple with disruptions, due in part to weather events. Reefer load counts fell 5 percent compared to May. Compared to June 2018, reefer volume was up 1.3 percent.
Flatbed volume dipped 2.4 percent compared to May, a seasonal trend that also mirrored the past two years. The volume of flatbed loads added 9 percent compared to June 2018.
“June is often considered a peak month for the spot market, but that’s truer for rates than volumes,” said Dorf. “We expect spot market volumes to gain strength in the second half of this year, although rates probably will not rebound to 2018 levels.”


