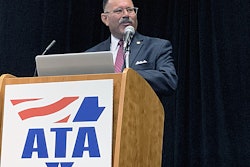
Kyle Warlick, client intelligence analyst at Lytx, presented new research data findings on Oct. 6 at ATA MC&E in San Diego.
Certain segments on major trucking lanes in Pennsylvania are so dangerous that professional drivers may want to avoid them altogether, according to recent analysis of event data by Lytx from November 2018 to August 2019.
The two most riskiest road segments in the United States are:
- Pennsylvania Route 309 intersection with Pennsylvania Route 145 and E Rock Road
- Pennsylvania Route 309: East of W Emaus Avenue
Pennsylvania had the most severe collisions of any state. The average severity level of incidents in Pennsylvania were twice as high as Texas, the only state that had more total incidents than Pennsylvania. Two other road segments in the state landed in the top five:
- Interstate 84 intersection with Pennsylvania Route 435 (Dunmore, Penn.)
- Interstate 81 / Pennsylvania Route 309 intersection with E Northampton Street (Wilkes-Barre Township, Penn.)
All four road segments are near interchanges or on/off ramps. The sudden lane changes and rapid changes in driving speed associated with these areas tend to amplify risk, especially amongst already risky drivers.
These and other insights were presented by Lytx on Oct. 6 in San Diego at the American Trucking Associations Management Conference and Exhibition (MC&E) as the company’s second annual “State of the Data.”
During the presentation at ATA MC&E, the company said this year is the second in a row that Pennsylvania Route 309 has been the riskiest roads in the country. Lytx is a global provider of machine vision and artificial intelligence-powered video telematics systems for commercial and public sector fleets.
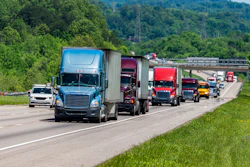
 According to Lytx data, the two most riskiest road segments in the United States are in Pennsylvania.
The analysis came from 5.5 million risky events and associated driving data captured from the 6.2 billion miles driven by motor carriers using the Lytx video telematics system.
When Lytx expanded its view from single-square-mile road segments to 60-by-60-square-mile areas, it found that trucking fleets displayed the most risk throughout greater Chicago. As a major transportation hub, and a common stop on western, eastern and midwestern routes, the area surrounding Chicago was found to be 18% more risky among trucking fleets than the next riskiest area.
“By understanding which areas are more volatile, like specific highway ramps or cities, drivers can proceed with greater caution and employ strategies that allow them to avoid unnecessary dangers,” said Del Lisk, vice president of safety services at Lytx.


Riskiest Times
Lytx trucking-industry data also uncovered a shift in the riskiest days of the week and times of day from last year’s analysis. The data below shows results from January-August 2019 compared to results from the similar period the year prior.
| 2019 | 2018 | |
| Day of week with most collisions | Thursday | Wednesday |
| Time of day with most collisions | Morning (5:00 a.m. – noon) | Overnight (11:00 p.m. – 5:00 a.m.) |
| Day of week with most near collisions | Wednesday | Friday |
| Time of day with most near collisions | Morning (5:00 a.m. – noon) | Afternoon (12:00 – 5:00 p.m.) |
| Day of week with least collisions | Monday | Monday |
“There’s an interesting shift in collision and near-collision trends, specifically that both are most prevalent in the morning hours,” said Kyle Warlick, client intelligence analyst at Lytx, who presented the findings at ATA MC&E.
Driver behaviors
The data shows improvements in several high-risk driving behaviors between November 2018 and August 2019, with drowsy driving as the most improved behavior:
| Most Improved Behaviors | Decrease from 2018-2019 |
| Drowsy driving | -25% |
| Late response | -24% |
| Falling asleep | -21% |
| Collisions | -16% |
| Near collisions | -13% |
Overall, Lytx trucking clients experienced 13% fewer risky driving events from January-August 2019 compared to the same period last year.
The relative prevalence of late response decreased by 24% from last year, but this behavior remains an issue in trucking, Lytx noted. The behavior is an event in which the driver was not known to be distracted yet responded late or abruptly to a readily visible risky situation ahead. This occurs 138% more often in trucking than any other industry that Lytx serves.
Vehicle height, the complexity of driving a larger vehicle and the mental fatigue of driving longer hours are all potential causes of late response specifically seen in trucking, Warlick said.
Another risky behavior with a heightened occurrence in trucking is not wearing a seatbelt; Lytx observed unbelted drivers 74% more frequently among trucking clients than any other group.
When compared to drivers in Lytx’s other client segments, including waste, distribution, transit, government, field services, construction and concrete, there are several high-risk behaviors truck drivers avoided more than drivers in the other client segments:
| Behavior | Comparative Frequency |
| Loose object in the cab | 73% less often |
| Aggressive | 38% less often |
| Blank Stare (day dreaming) | 17% less often |
Blank stare occurred when a driver’s eyes were looking forward, but there was very little to no eye movement or activity, and as a result, the driver responded late to a situation ahead. Drivers who exhibit blank stare — a behavior often associated with daydreaming — are more than 200% more likely to experience a collision in the next 90 days than a driver who does not display the behavior.
“As truck drivers generally drive for the longest periods of time and distances compared to other industries, it’s incredibly impressive these professionals have the lowest instances of blank stare, which we’ve found to be one of the most dangerous behaviors a driver can exhibit,” Lisk said.
There are other risky behaviors lurking in trucking cabs that Lytx says the industry will need to pay close attention to. The data show the most prevalent behaviors among truck fleets and year-over-year frequency comparison:
|
Top 5 Behaviors (in order of prevalence) |
2018-2019 Frequency |
| Driver not wearing a seatbelt | Increasing |
| Cell phone use | Increasing |
| Late response | Decreasing |
| Speed violations | Increasing |
| Following distance: ≥ 1 second to < 2 seconds | Decreasing |