Have you ever seen a three-ring binder full of napkins?
While napkins around the world bear witness to great ideas written during the haste of inspiration, routinely falling back on this approach for trip costing and planning doesn’t exactly make full use of all resources, namely analytical software that can better assess the profitability of trucking routes and take napkin math to another level.
But be careful, advises Dan MacKenzie, vice president of pricing and credit for Toronto-based XTL Transport. While no one knows your own business quite like you, taking a do-it-yourself approach to building a program around a complicated topic such as cost and profitability analysis may not work as planned.
“We had been looking for something, and we actually thought we could build it ourselves, and after five years of thinking and trying, we realized we can’t,” MacKenzie said.
At that time, roughly seven years ago, XTL turned to Transportation Costing Group, which in 2015 was acquired by SMC3, the long-time Atlanta-based data solutions company that traces its roots back to the Motor Carrier Act of 1935.
SMC3’s Cost Intelligence System (CIS) has proven to be a good match for XTL in sizing up route costing and profitability based on analyzing a truck’s entire round trip with a focus on operating ratio. The ongoing goal is to help offset empty miles — that leg of a trip where a truck is not hauling a load and thus is incurring more cost without pulling in additional revenue.
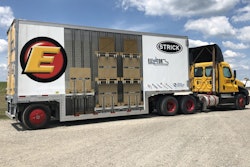
 Demo of a freight-bill query screen from SMC3’s Cost Information System showing the cost results for a specific load.
CIS, which can be used for truckload and less-than-truckload carriers, uses joint cost accounting to examine how expenses impact the truck’s entire round trip, not just one leg of the journey. Conversely, revenue for the round trip is measured against joint cost to help determine profitability.
“Joint cost for trucking is where multiple loads are moved on one round trip,” said Bill Shults, vice president of cost systems for SMC3. “If a company sends a Georgia-based driver with a load to Florida, and next he takes another load from Florida to North Carolina, and finally a third load from North Carolina back to Georgia, they have ‘purchased’ one round trip from that driver.


“The cost of the three individual loads,” Shults continued, “can’t just look at miles for each but must recognize that all are made from that same round trip, and the cost allocation should be based on the contribution each makes to that round-trip cost.”
CIS also hones in on operating ratio, a basic profit measure that results from taking operating expenses and dividing by revenue. During a recent Truckload Carriers Association webinar titled Dealing with Balance and Empty Miles in Freight Profitability Analyses, Shults provided some examples.
“A 100% operating ratio is break even,” he said. “It means for every dollar of revenue, there’s also a dollar of expense. A 110% operating ratio means that there’s $1.10 of expense for every dollar of revenue, so you’re losing 10 cents for each revenue dollar. A 90% operating ratio would mean that you’re making 10 cents for every revenue dollar. It’s kind of counterintuitive sometimes, because the higher the number gets, the worse the profitability is.”
Focusing on operating ratio was a little challenging at first for XTL.
“That was a word we didn’t use a lot,” MacKenzie said. “We used revenue per mile or revenue per hour or the revenue number. But we rarely tried to get people to ask, ‘What’s the OR on that customer or that lane?’ ”
The additional measurement has been a welcome change for XTL, which has been taking a closer look at driver behavior.
“If their OR is bad, we have to look at them and say, ‘What are we doing to this driver where he’s not profitable? He’s making money, he’s busy, but he’s not profitable, so what are we doing wrong?’ ” MacKenzie said. “Maybe it’s the way we’re dispatching him or the way he starts his week or something. It’s a really useful tool and a nice thing, because the tool’s doing the same calculation for everyone. And the fact that it matches our P&L, that’s important too.”
MacKenzie said XTL has seen around a 5% uptick in OR with CIS and that the system proved its worth in 2018 when market capacity tightened up and required a closer look at lanes for possible rate increases.
“When I look back, I don’t know how we did it manually,” MacKenzie said. “I have a few friends who don’t have the tool, and I keep asking them, ‘Get the tool. Why don’t you?’ But this tool or another tool, they’re still doing it on the back of napkin, and I said, ‘I don’t know how you do it.’ ”
A humbling start met with resistance
XTL is a truckload carrier with 375 tractors that haul dry vans, reefers and heated trailers loaded with consumer goods in Canada and the United States. Like any efficiency-minded carrier, XTL always is interested in improving its bottom line. Realizing the futility in creating its own analysis program, the company began considering software from various vendors. After talking with other carriers and getting a demo, XTL chose SMC3’s CIS.
“We’ve had the tool maybe seven years now,” MacKenzie said. “We were doing it manually before. The activity-based costing … that was a really big step forward for us to be able to start applying a cost based on what that customer was doing or what that lane was doing. That was really an eye-opener for us. We hadn’t approached costing that way before.”
Another CIS accounting method requires XTL to gauge success based on an entire round trip. It’s a concept that doesn’t always go over well with sales representatives and customers accustomed to assessing one lane of a trip.
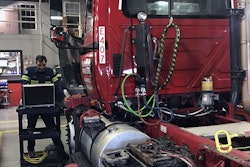
 XTL Transport, based in Toronto, reports improved efficiency with the Cost Information System.
“A lot of people just look at one lane and say that it’s a profitable lane or unprofitable lane, but you really need to look at the whole package, and people find that hard to do,” MacKenzie said. “They look and say, ‘This lane’s losing money. Let’s get rid of it.’ But if the whole package is profitable, then you really want to try and improve that poor lane.”
XTL’s prior efforts at winning others over to “whole package” assessments were even tougher in the days before CIS.
“We had customers asking, ‘How are we making money? We’re losing money on this one.’ Yeah, but it puts us into an area that’s really good,” MacKenzie said. “And we tried to do that manually, but it was a lot of work and really hard, and people didn’t believe me when I did it manually. But when the system did it, I think people just believed it a lot more.”
Of course, all new systems come with growing pains, and for XTL it was its data pool that, as the long transition to CIS began, proved to be lacking.
“We thought our data was pretty good, and it really opened our eyes to the fact that our data wasn’t as good as we thought, and we were embarrassed,” MacKenzie said. “Anybody who wants to get into this, just make sure you know your data really well, and clean your data, because [the system] is as good as the data.”
It took about a year to make the switch to CIS, which provided XTL with opportunities to clean up its data.
“We would meet every Friday — sales and operations and pricing,” MacKenzie said. “We’d get this tool and start going through, and we’d find examples and say, ‘What happened to this?’ We’d blame the system. Something’s wrong with the system. And [SMC3] helped walk us through, and we’d look and say, ‘No, it’s right.’ Maybe a driver broke down, and another driver rescued them, so all of a sudden, you had more costs on a load, or a driver rerouted because of a bad winter storm. Or maybe he went way out of route because a highway was closed, so his miles and hours were a lot more than they should have been. But they would highlight that, and I’d say 99 times out of a hundred, the system was right, or it was bad data and it was based on the data that we provided the system, so we had to go back to the drawing board on some and fix it, because our data was not as good.”
Membership has its benefits
CIS does more than look back at route performance, though history does set the tone for how to move forward.
“There’s two uses of the system,” Shults said. “One is to look at your history — how are we doing, and are these customers paying their way? In that case, we’re looking at what they actually did. Every month after they’ve closed their books, we cost all the freight they’ve moved in that month and match everything all back. But then on the prospective side, we take their experience to say, ‘Our experience going into Florida is we’ve got to get at least this much mone,y or we’re not going to make it.’ ”
Though announcing a rate hike is less than enviable work, having the data to show a customer why the increase is necessary makes the job easier, MacKenzie said.
Some reports pointing out unprofitability can be a little puzzling and may call for important changes. For instance, two legs of a round trip may be profitable, yet the entire trip may still be considered a loss.
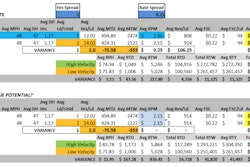
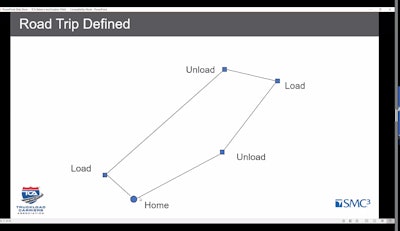
 Slide from SMC3’s webinar last month presented by the Truckload Carriers Association shows the roundtrip analysis performed by Cost Information System. The webinar “Dealing with Balance and Empty Miles in Freight Profitability Analyses” is available for viewing on TCA’s website.
“That’s when we realized this third leg is an anchor and that some of them aren’t fixable,” MacKenzie said. “But some customers aren’t fixable, and you hate to say goodbye to some, but if it’s not profitable, you’ve just got to go your separate ways and let someone else do it.”
In keeping with SMC3’s longstanding tradition of education and collaboration, CIS offers conferences where members can talk shop and share ideas. However, rates and customer data are off the table.
“You’re almost joining a club, and other carriers are very open to tell you how they do things and how they use the tool,” MacKenzie said. “So even though we’re competitors, we’re often in different regions or different areas or different industries, but at these conferences, people do share ideas and help each other.”
The annual conferences also provide carriers a chance to learn about the latest CIS update and how it can help improve the bottom line.
“No one has a huge advantage over others,” MacKenzie said. “It’s just how you operate. With all those little pieces, what can you do that someone else couldn’t do maybe a little better? It all comes down to pennies. Can I do this for 5 cents a little smarter or better than someone else? At the end of the day, that 5 cents all adds up.”